Coming soon!
Essentials of Modern Business Statistics with Microsoft® Excel®
Anderson, Sweeney, Williams, Camm, and Cochran
07th Edition
Experts Have Solved This Problem Please login or register to access this content.
Experts Have Solved This Problem Please login or register to access this content.
Given the sample size and population proportion, find the mean and standard deviation of the sample proportion.
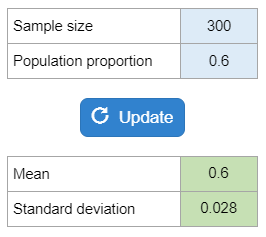
Your numbers will vary.
Is it reasonable to conclude categories were a certain proportion, what percent were from other, select the diagram? Experts Have Solved This Problem Please login or register to access this content.
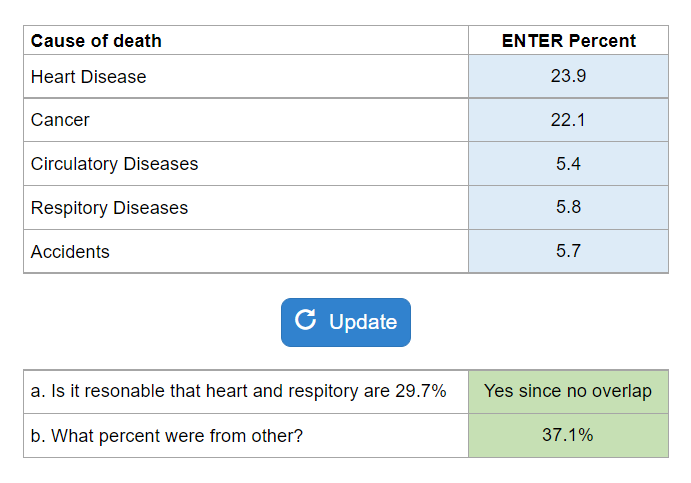
Your numbers will vary.
What % reported a positive change, negative change, and combinations of that question.
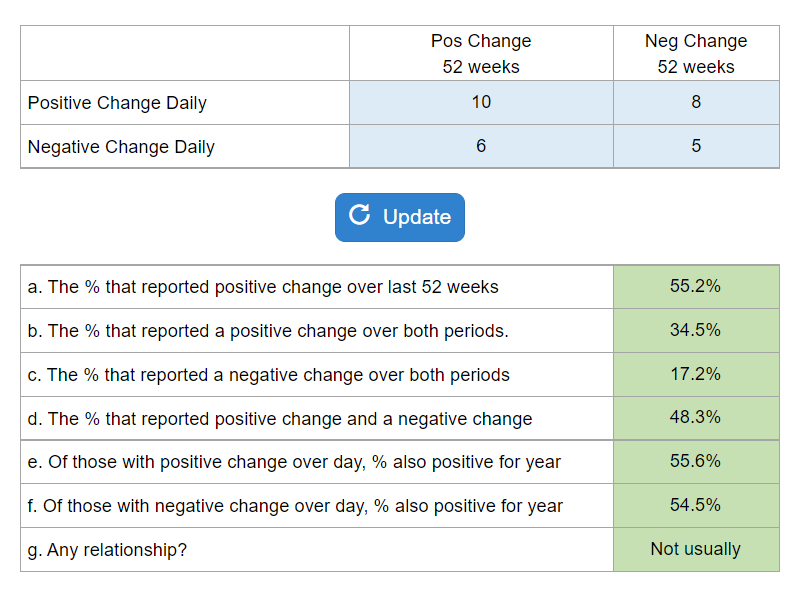
Your numbers will vary.
Find the conditional distribution of both wireless and nonwireless (other). Create a graph. Do you see any differences?
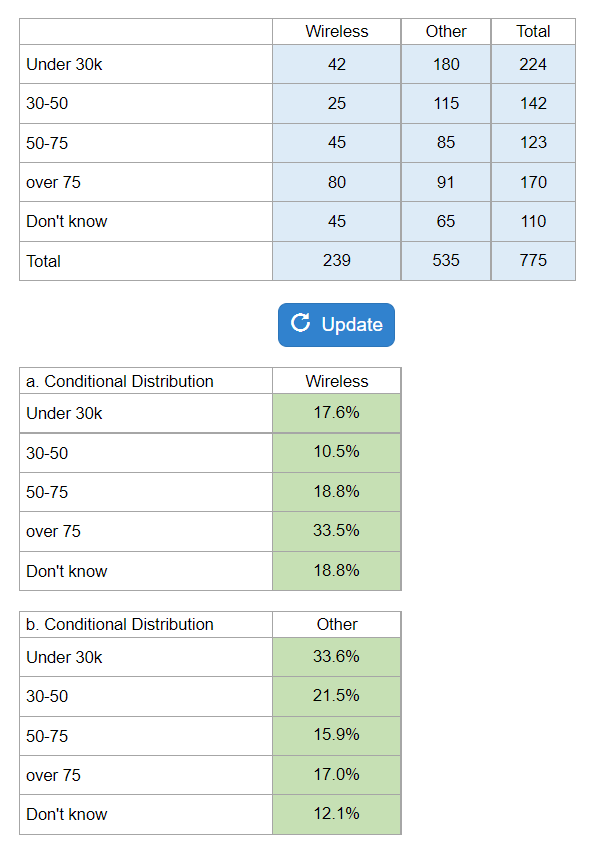
Your numbers will vary.
Percent of MBA from Region, Two-years and evening from region, marginal distribution, conditional distribution, independent.
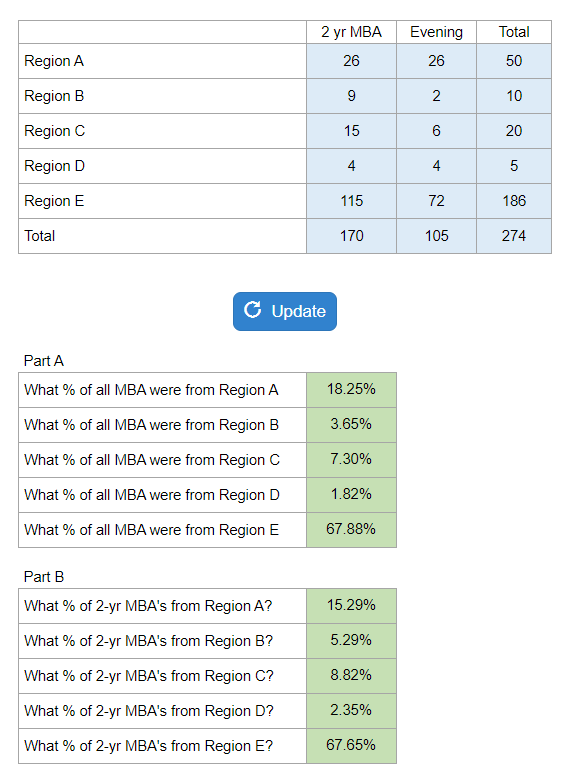
Your numbers will vary.
What % admitted, higher or lower for females, compare, program admission rates.
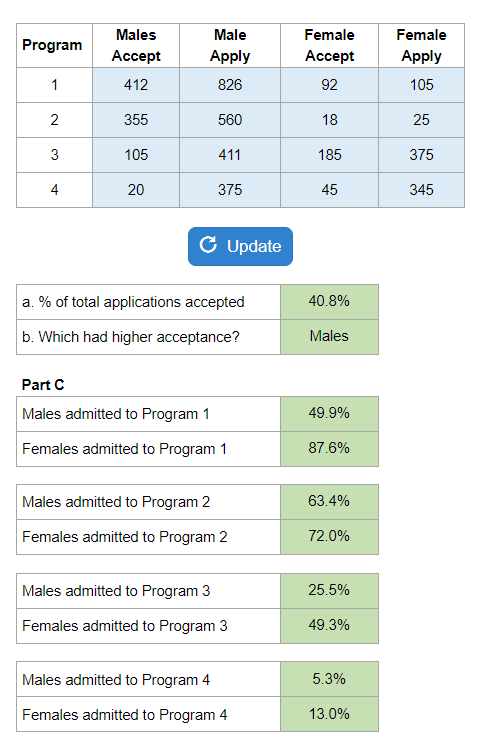
Your numbers will vary.
A histogram is presented with a series of questions about shape, center, spread, asks why the weird shape.
From raw data and a provided histogram, calculate the minimum, maximum, median, Q1, Q3, mean, IQR, range.
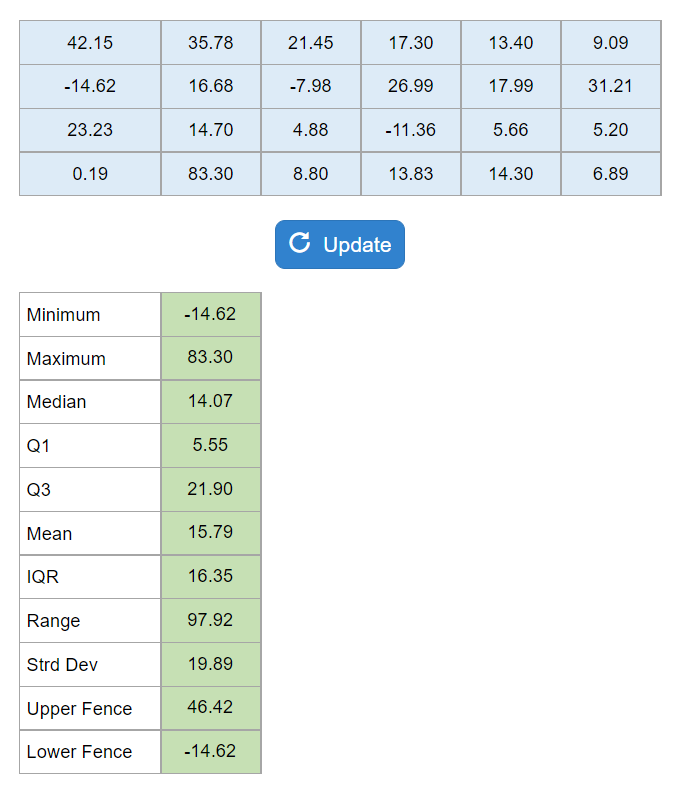
Your numbers will vary.
A long list of data numbers is given and student is asked to make a stem-leaf plot, box plot, answer questions.
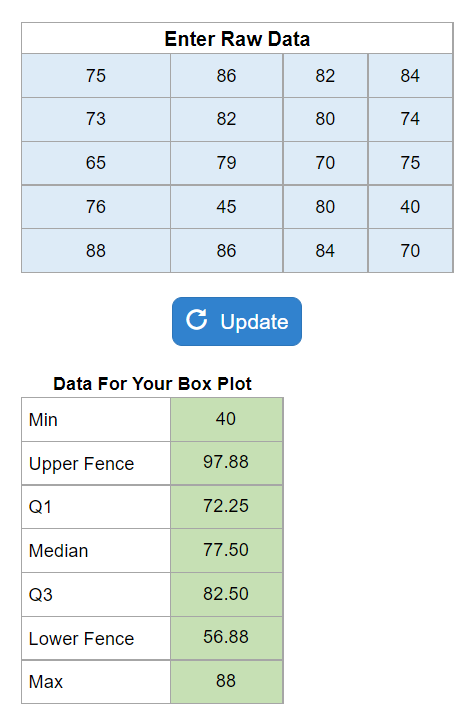
Your numbers will vary.