3.1.51 – Box Plots of Weekly Gas Prices
MyStatLab
Pearson
Three box plots of gas prices are given with questions on spread, skewness, outliers, and IQR.
Three box plots of gas prices are given with questions on spread, skewness, outliers, and IQR.
A scatterplot plots is shown with R-squared, intercept, CO2 with questions about meaning of R-squared, equation, meaing of slope, meaning of y-intercept.
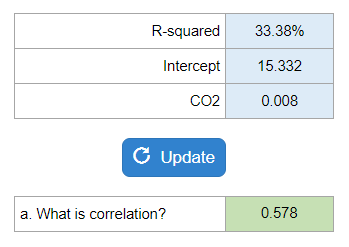
Your numbers will vary.
They give you a horizontal list of # of traffic lights and probabilities. They ask you for a mean and standard deviation.

Your numbers will vary.
Given the amount in the sample, the sample proportion, and the confidence level they ask you to construct two confidence intervals.
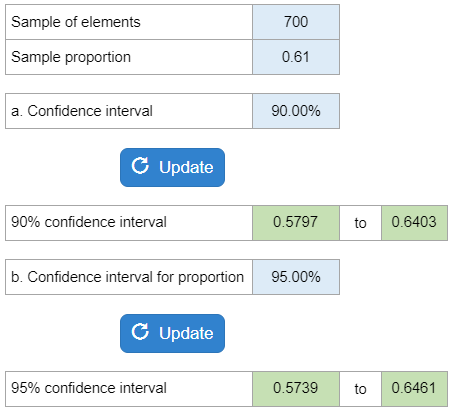
Your numbers will vary.
Determine how large a sample should be taken to obtain a margin of error for the estimation of a population proportion.
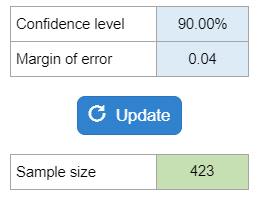
Your numbers will vary.
Determine the sample needed if the research firm’s goal is to estimate the current proportion of homes with a stay-at-home parent in which the father is the stay-at-home parent with a margin of error and a confidence level.
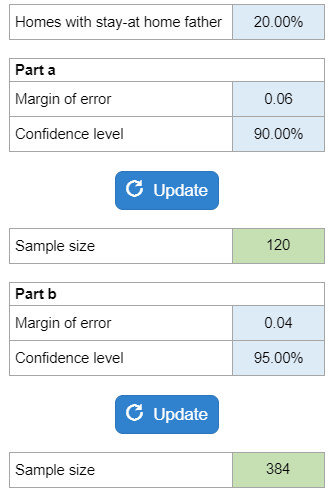
Your numbers will vary.
Construct a point estimate of the proportion of items returned for the population of sales transactions at the store in the given city. Construct a confidence interval for the proportion of returns. Develop appropriate hypotheses, find the test statistic, p-value, and conclusion.
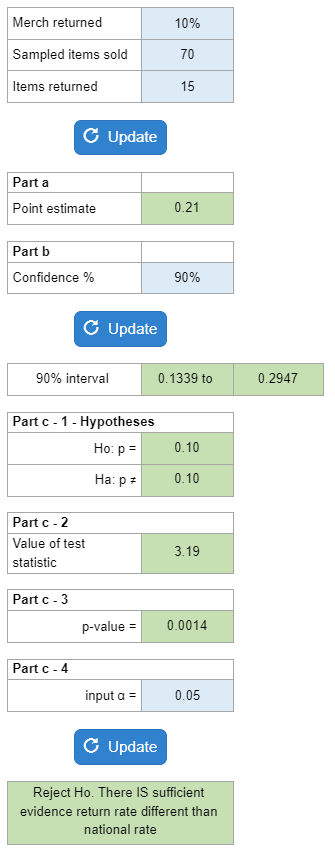
Your numbers will vary.
Experts Have Solved This Problem Please login or register to access this content.
Given the sample size and population proportion, find the mean and standard deviation of the sample proportion.
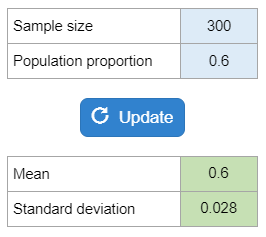
Your numbers will vary.
Is it reasonable to conclude categories were a certain proportion, what percent were from other, select the diagram? Experts Have Solved This Problem Please login or register to access this content.
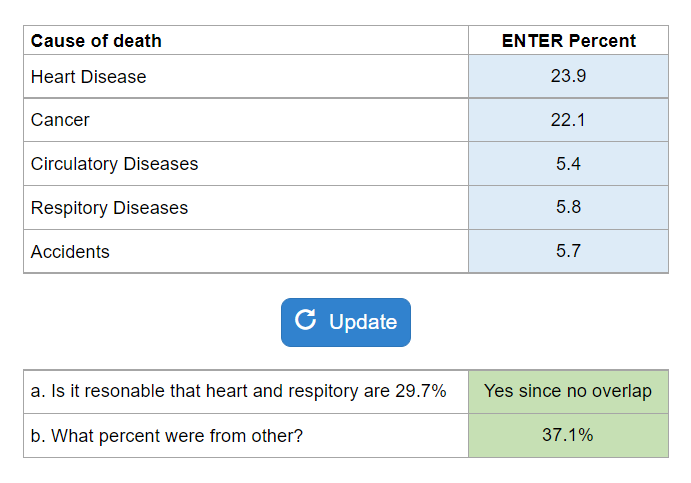
Your numbers will vary.