3.1.51 – Box Plots of Weekly Gas Prices
MyStatLab
Pearson
Three box plots of gas prices are given with questions on spread, skewness, outliers, and IQR.
Three box plots of gas prices are given with questions on spread, skewness, outliers, and IQR.
A scatterplot plots is shown with R-squared, intercept, CO2 with questions about meaning of R-squared, equation, meaing of slope, meaning of y-intercept.
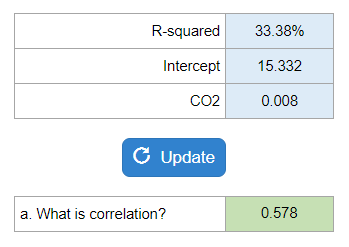
Your numbers will vary.
They give you a horizontal list of # of traffic lights and probabilities. They ask you for a mean and standard deviation.

Your numbers will vary.
Develop a predictive model to assist marketing efforts by examining the relationship between home values and landscaping expenditures using data provided in the file Landscape. What does the scatter plot suggest about the relationship between the variables? Calculate the estimated regression equation using the least squares method and use it to predict landscaping expenditures for homes of varying values.

Your numbers will vary.
Given the amount in the sample, the sample proportion, and the confidence level they ask you to construct two confidence intervals.
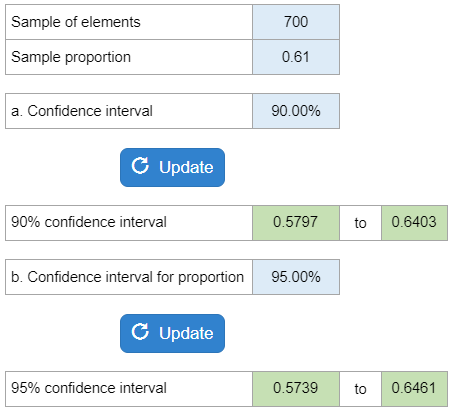
Your numbers will vary.
Determine how large a sample should be taken to obtain a margin of error for the estimation of a population proportion.
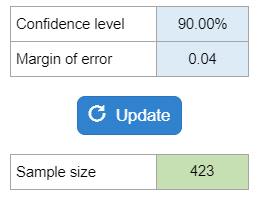
Your numbers will vary.
Determine the sample needed if the research firm’s goal is to estimate the current proportion of homes with a stay-at-home parent in which the father is the stay-at-home parent with a margin of error and a confidence level.
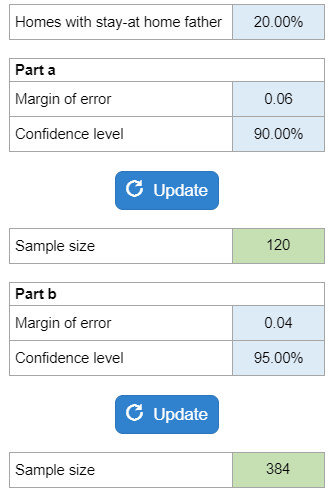
Your numbers will vary.
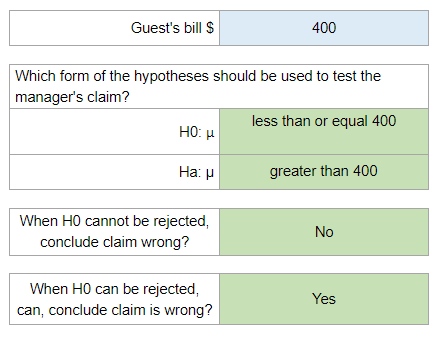
Test the manager’s claim that the mean guest bill for a weekend is $600 or less by selecting the appropriate form of hypothesis. If the null hypothesis cannot be rejected, we cannot conclude that the manager’s claim is wrong. However, if the null hypothesis can be rejected, we can conclude that the manager’s claim is wrong.
Your numbers will vary.
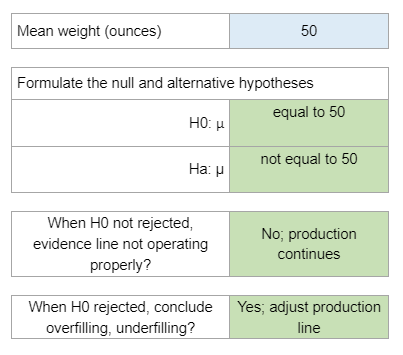
Formulate hypotheses to decide whether to shut down and adjust the production line based on sample data. Determine if evidence suggests the production line is not operating properly or if overfilling or underfilling exists.
Your numbers will vary.
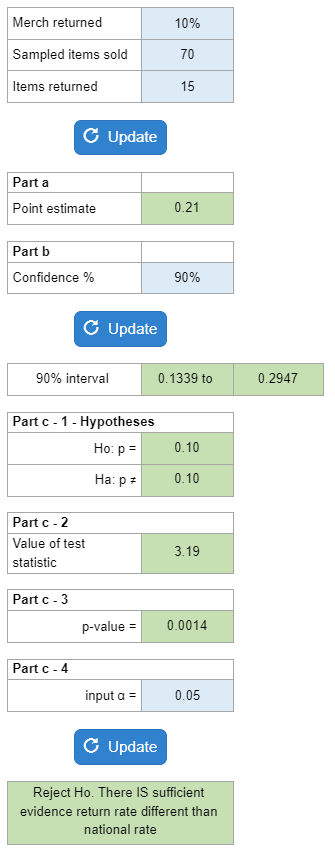
Construct a point estimate of the proportion of items returned for the population of sales transactions at the store in the given city. Construct a confidence interval for the proportion of returns. Develop appropriate hypotheses, find the test statistic, p-value, and conclusion.
Your numbers will vary.