3.1.51 – Box Plots of Weekly Gas Prices
MyStatLab
Pearson
Three box plots of gas prices are given with questions on spread, skewness, outliers, and IQR.
Three box plots of gas prices are given with questions on spread, skewness, outliers, and IQR.
Given the relative frequency and total return for four stocks… find the weighted average total return.
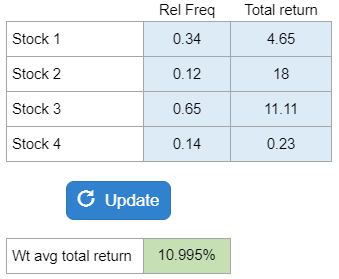
Your numbers will vary.
Given three x and y’s … find the sample variance and sample standard deviations
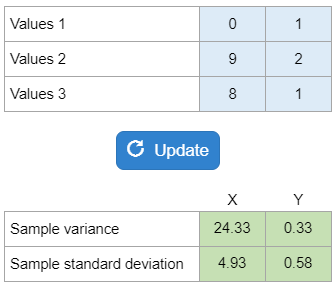
Your numbers will vary.
They give you the deposits for the account. Asks for the upper quartile, lower quartile, and interquartile range, the upper and lower boundaries for outliers.
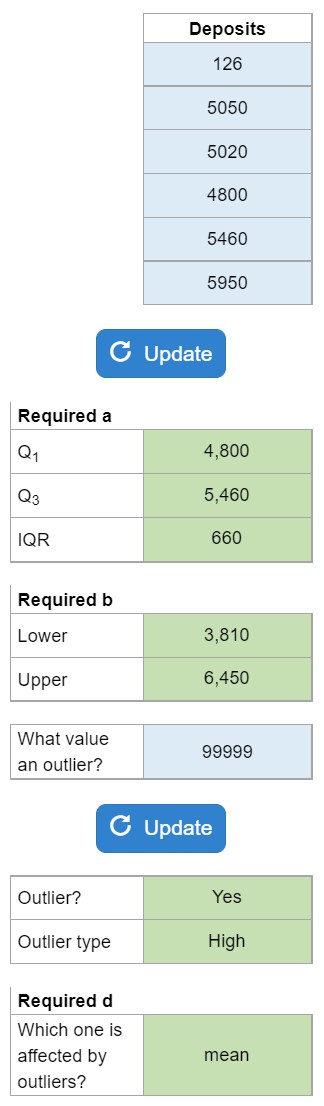
Your numbers will vary.
They give you a table with percentages. They ask you for the mean, median, Q1, Q3, range, IQR, Variance, SD, and outliers.
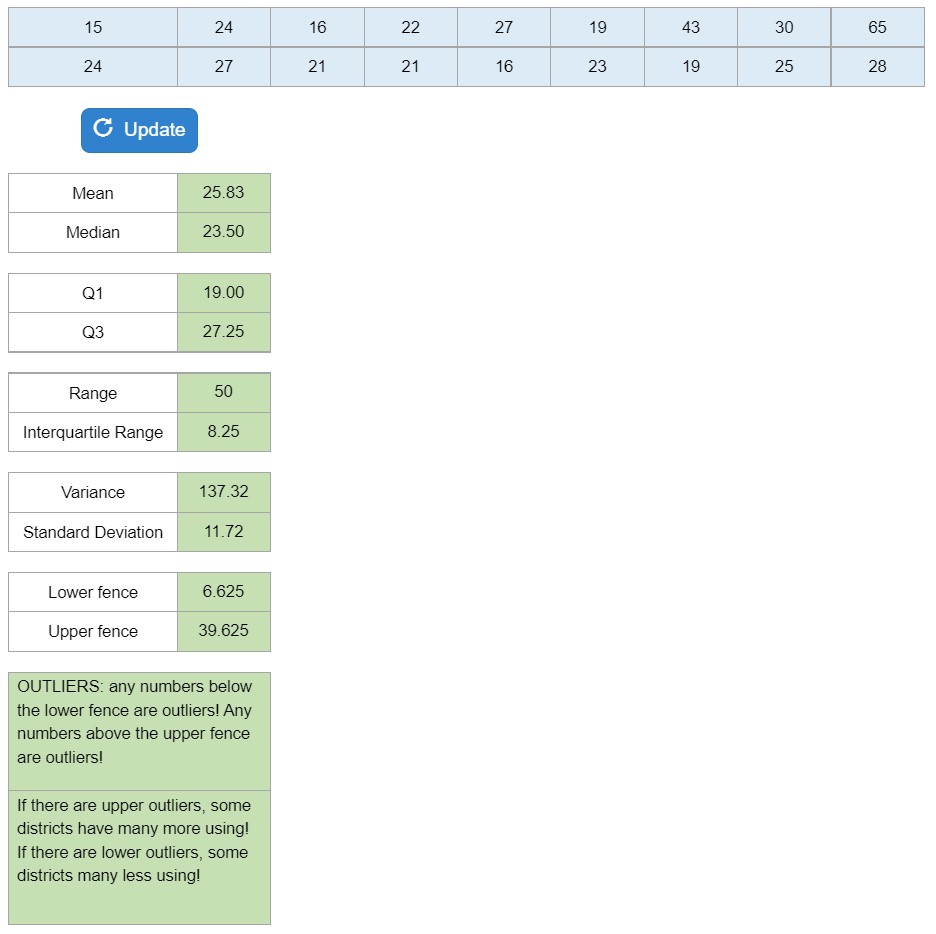
Your numbers will vary.
They give you a histogram with different numbers of rat pushes. They ask for the mean and range.
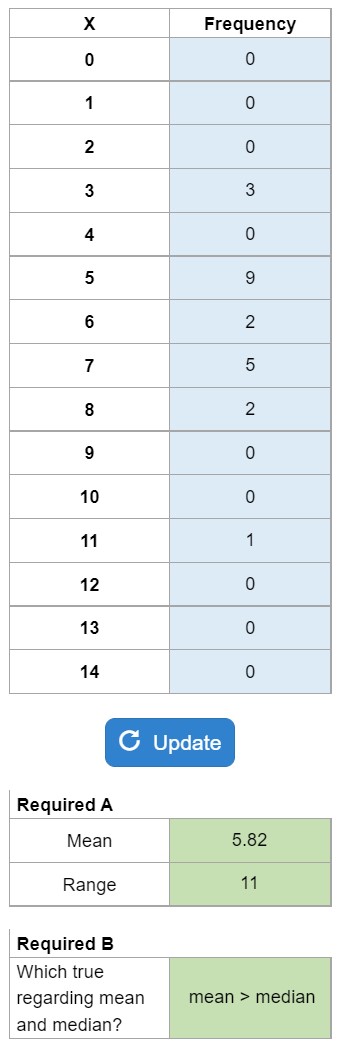
Your numbers will vary.
They give you a stem and leaf and ask for the medians.
Your numbers will vary.
Given the correlation coefficient, they ask you to calculate the coefficient of determination.
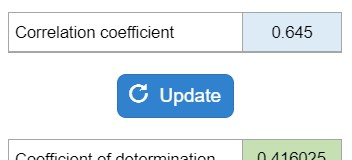
Your numbers will vary.
Given the number of states that a candidate visited in the last months they ask you to determine the upper quartile, lower quartile, interquartile range, upper and lower boundaries, and whether the given number is an outlier.
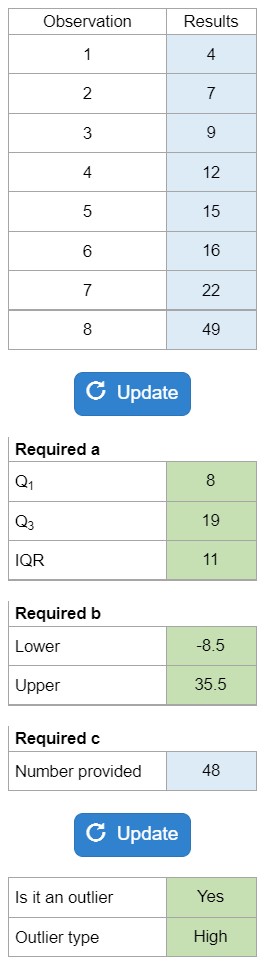
Your numbers will vary.
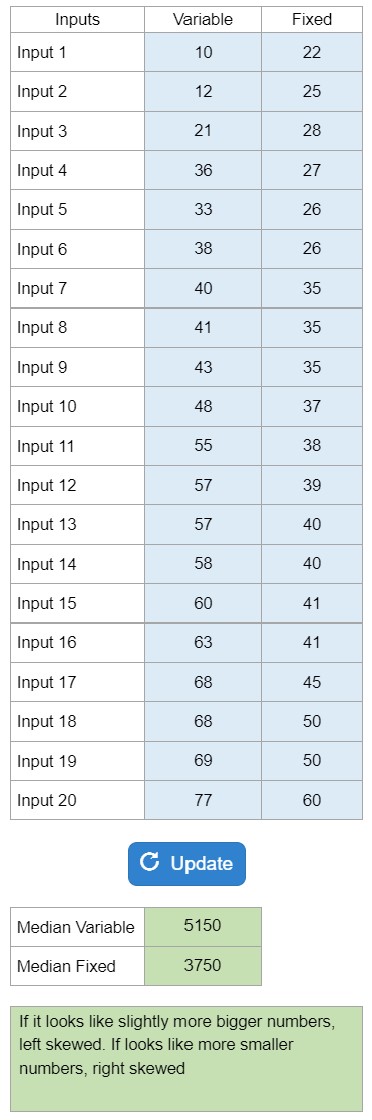
Gives you a table split up with 2 different age groups. Asks for the mean and median for both groups and a comparison.
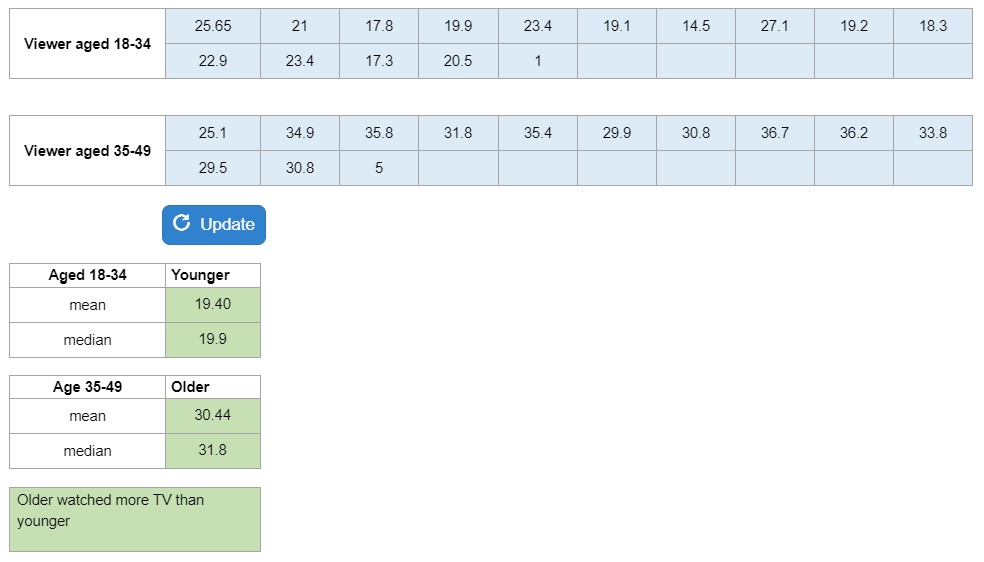
Your numbers will vary.