3.1.51 – Box Plots of Weekly Gas Prices
MyStatLab
Pearson
Three box plots of gas prices are given with questions on spread, skewness, outliers, and IQR.
Three box plots of gas prices are given with questions on spread, skewness, outliers, and IQR.
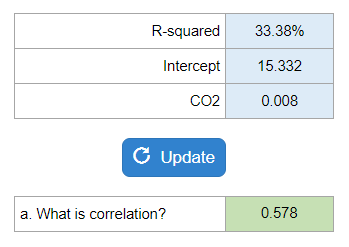
A scatterplot plots is shown with R-squared, intercept, CO2 with questions about meaning of R-squared, equation, meaing of slope, meaning of y-intercept.
Your numbers will vary.
They give you a horizontal list of # of traffic lights and probabilities. They ask you for a mean and standard deviation.

Your numbers will vary.
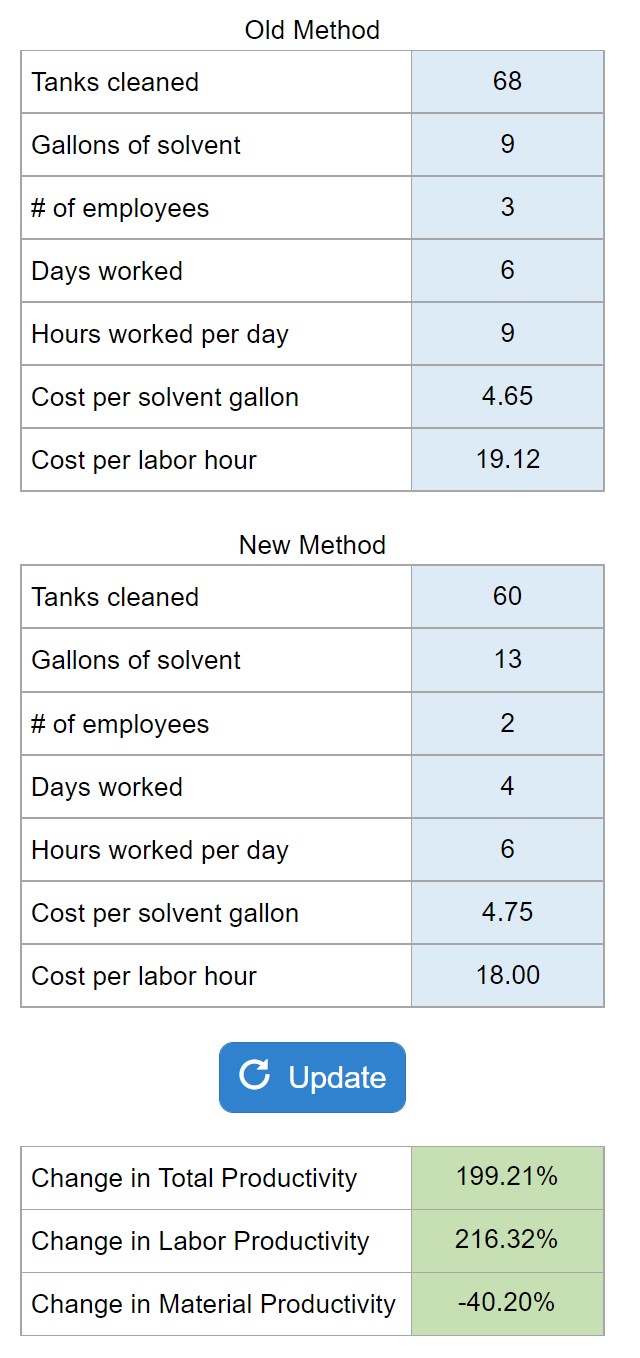
They give you labor and solvent and ask for change in productivity.
Your numbers will vary.
They give weights and scores for two suppliers and ask which supplier should be chosen and what is the score for that vendor.

Your numbers will vary.
Gives a accounts receivable and the estimated amount not collected and asks what the accounts receivable would be valued at.
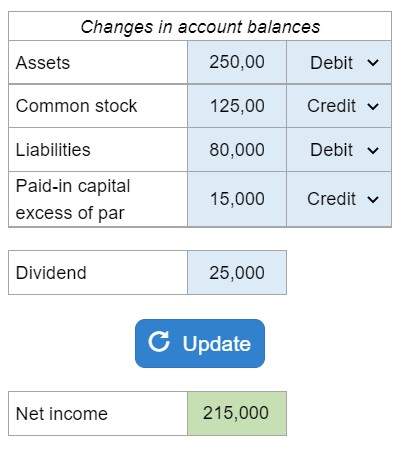
Given changes in account balances as either debits or credits, including assets, common stock, liabilities, and paid-in capital, determine net income for the year.
Your numbers will vary.
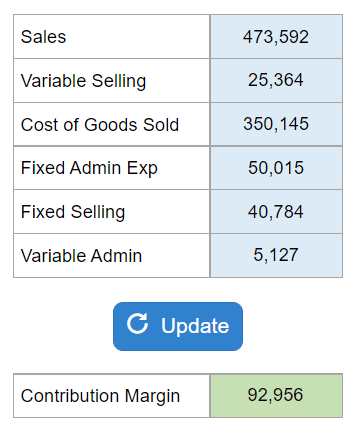
Gives Sales, variable selling expenses, cost of goods sold, fixed admin and selling, var admin. Asks for the contribution margin.
Your numbers will vary.
Gives retention rate, frequency of purchase, cost of station, etc. Asks for the Value of a Loyal Customer
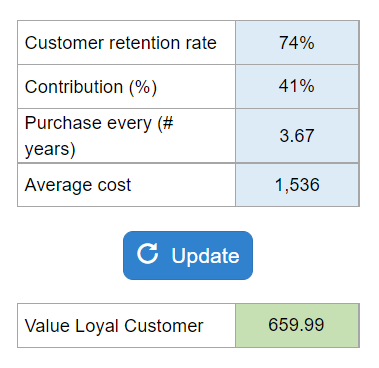
Your numbers will vary.
They give you the days in the month that the shop is operational, the demand for boxes of candles, how many can be produced in an hour, and the setup cost. Asks for the optimal inventory policy to minimize monthly inventory costs, days to produce boxes, cycle time, and optimal order quantity.

Your numbers will vary.