CH 1 – Kona Coffee
MyOMLab Operations Management
Heizer, Render and Munson
13th Edition
Given four cities along with productivity numbers… find which city to get rid of.
Calculator Preview
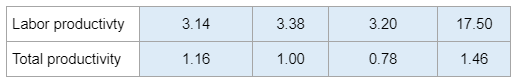
Your numbers will vary.
Given four cities along with productivity numbers… find which city to get rid of.
Your numbers will vary.
Given crew size and yards installed… find which day had the greatest productivity
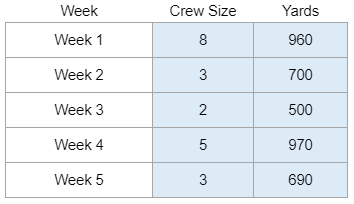
Your numbers will vary.
Given scenarios of change in productivity (such as output increasing 10%, input decreasing 5%, etc)… find the largest improvement.
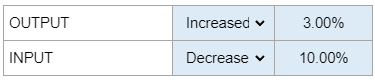
Your numbers will vary.
Given the recent annual report (assets and the condensed income statement)… calculate inventory turnover and/or weeks of supply.
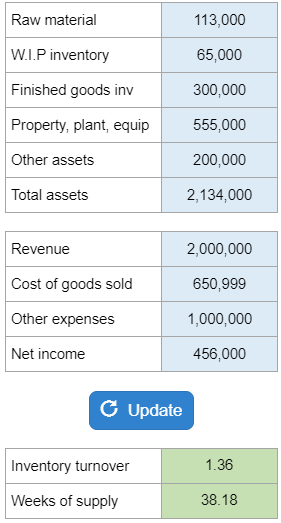
Your numbers will vary.
They give you the days in the month that the shop is operational, the demand for boxes of candles, how many can be produced in an hour, and the setup cost. Asks for the optimal inventory policy to minimize monthly inventory costs, days to produce boxes, cycle time, and optimal order quantity.

Your numbers will vary.
They give you the cases sold in one year, they tell you the price to process and price per case and the amount of days they are open. Asks for the optimal inventory policy to minimize cost, cycle inventory level, economic order quantity, and cycle time.
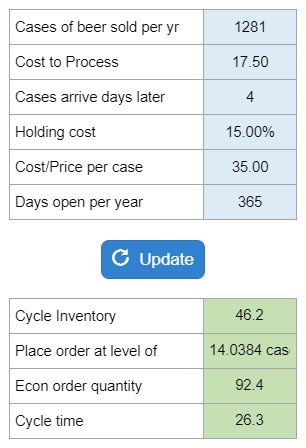
Your numbers will vary.
Given the size of the waiting room, the number of customers that arrive per hour, and how long each spends in the store… figure out how many customers are in the shop at any one time.

Your numbers will vary.
Given information on a fleet of rental cars, what percent are rented each day on average, and how long each rental period is… find out how many rentals are processed per day. (Works for the boat rental problem)
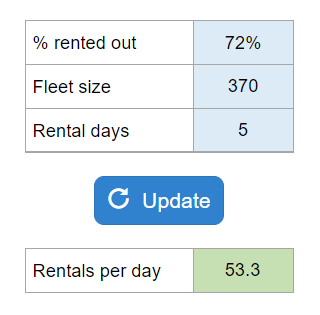
Your numbers will vary.
Given activities W, X, and Y – along with normal time, crash time, normal cost, crash cost… find the crash cost for each activity.
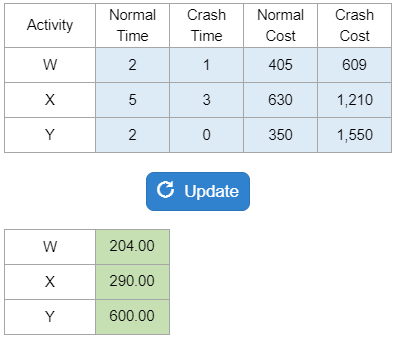
Your numbers will vary.
Given the demand and forecast for each period… find the MAPE
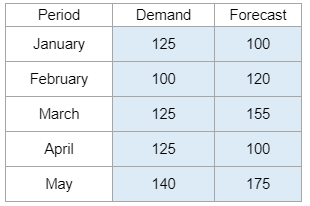
Your numbers will vary.