7.1.37 – Two Standardized Tests
MyStatLab
Pearson
Gives mean and standard deviation for two different tests and asks for z scores and higher relative scores.
Calculator Preview
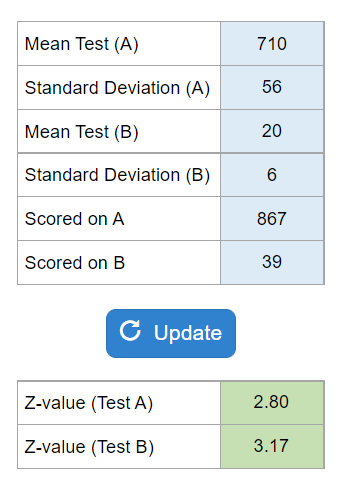
Your numbers will vary.
Gives mean and standard deviation for two different tests and asks for z scores and higher relative scores.
Your numbers will vary.
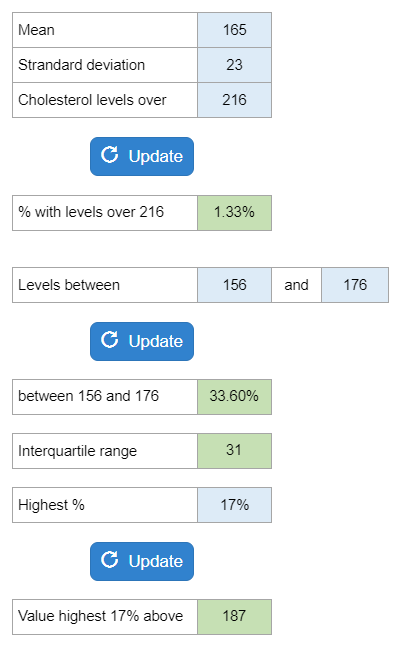
They give a mean and a standard deviation and ask to choose the appropriate bell curve and ask what percent is over a value, between, IQR, and highest X percent.
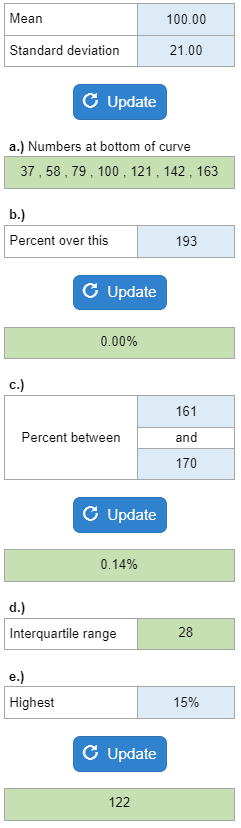
Your numbers will vary.
Given the mean and standard deviation of the amount of hours of exercise middle managers get per week, use the normal model to find the percentage of managers that exercise one standard deviation below the mean, find what this means according to the problem, and explain the problem using the normal model.
Your numbers will vary.
Gives the mean and standard deviation for highway driving and asks to draw the model, find the central 95%, 95.7%, more than X mpg, between two mpg, best and worst 2.5% mpg. Uses 68 – 95 – 99.7 rule.
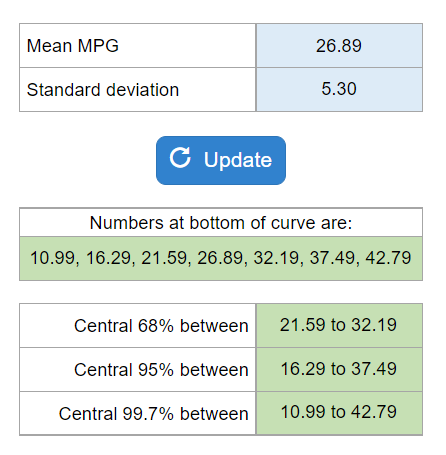
Your numbers will vary.
You’re given the percentage of successful first serves. Asks you to find the probability she will make atleast a certain amount of her first serves in the next match.
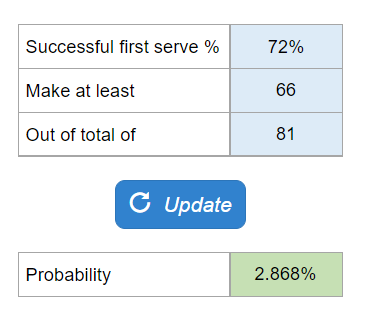
Your numbers will vary.
For a number of trading days, gives the mean stock price and standard deviation. Asks above a certain price, below, between, and which is more unusual.
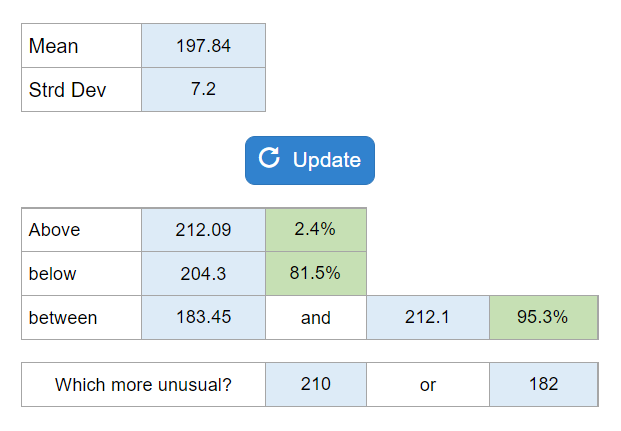
Your numbers will vary.
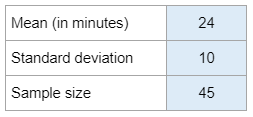
Find mean (in minutes) of the sampling distribution of mean commute time, standard deviation of sampling distribution, and describe the shape of the sampling distribution.
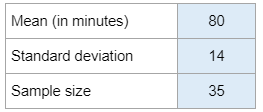
Your numbers will vary.
Given % in default and sample size and ask you to provide the mean of the sampling distribution and standard deviation.
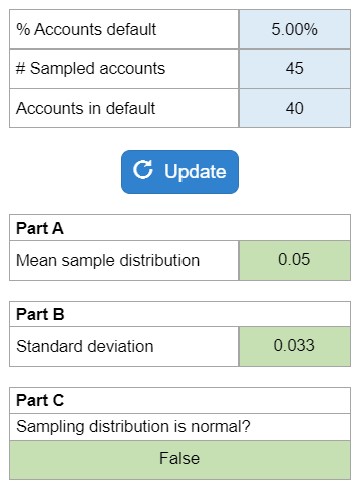
Your numbers will vary.
Given certain sample proportions, provide probabilities.
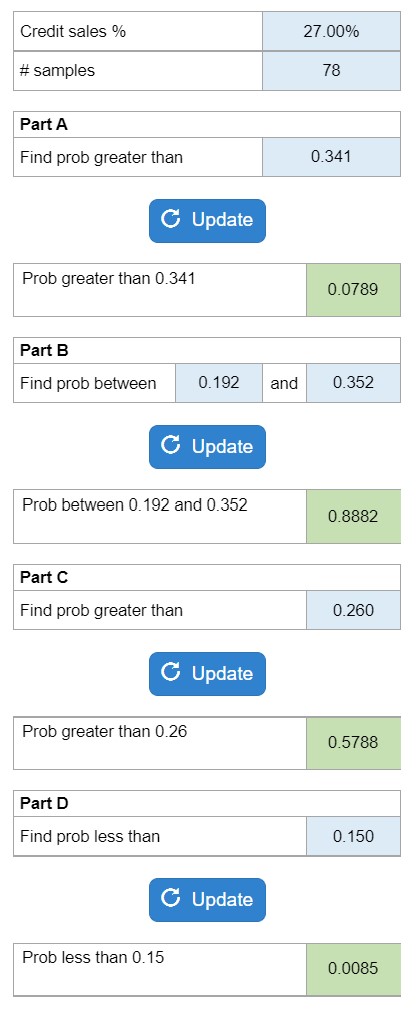
Your numbers will vary.
Determine the shape of the sampling distribution of sample wait times.
Your numbers will vary.