7.6.28 – IBM Trading Days
MyStatLab
Pearson
For a number of trading days, gives the mean stock price and standard deviation. Asks above a certain price, below, between, and which is more unusual.
Calculator Preview
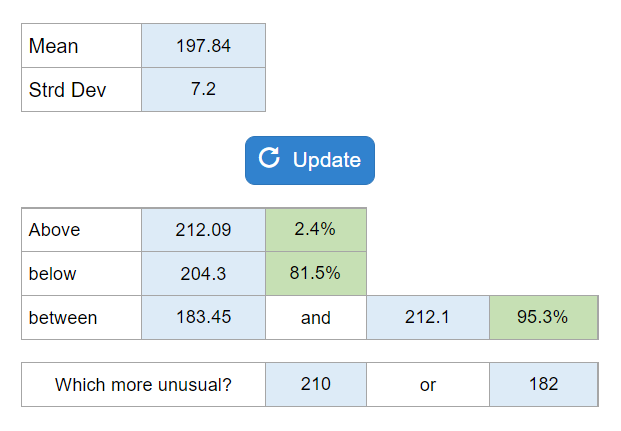
Your numbers will vary.
For a number of trading days, gives the mean stock price and standard deviation. Asks above a certain price, below, between, and which is more unusual.
Your numbers will vary.
Given three x and y’s… find the mean and median.
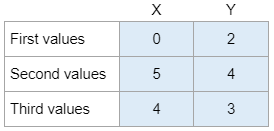
Your numbers will vary.
Given a list of 30 students’ majors… construct a frequency distribution, a bar chart, and a relative frequency distribution.
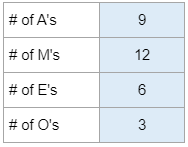
Your numbers will vary.
Given the relative frequency and total return for four stocks… find the weighted average total return.
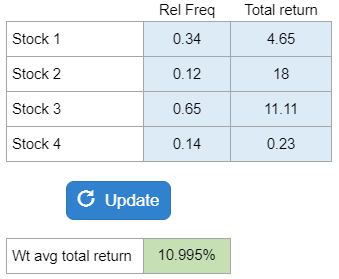
Your numbers will vary.
Given three x and y’s … find the sample variance and sample standard deviations
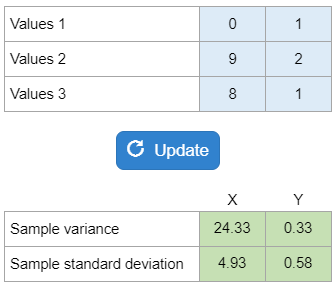
Your numbers will vary.
Given the probability individual purchasing product, the probability individual recalls seeing the advertisement, and the probability of both… find the probability B or S, purchase given recall seeing.
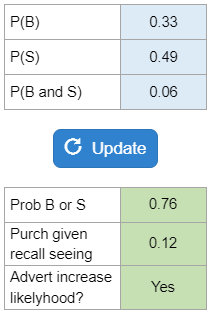
Your numbers will vary.
Given a chart showing the distribution of ACT scores among males and females… determine the amount of students in a certain criteria, compute row percentages, and compute column percentages.

Your numbers will vary.
Given some results of the survey… fill in the missing cell counts, marginal totals, and determine the percentage for an age group.
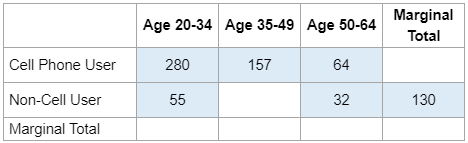
Your numbers will vary.
Given you flip coin 5 times… how many ways to get heads.
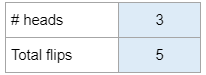
Your numbers will vary.
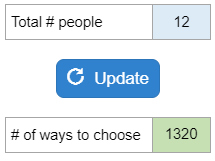
Given the group of people… find out how many ways to pick a president, secretary, and treasurer.
Your numbers will vary.