5.2.21 – The % of Households that Say they Would be Secure
MyStatLab
Pearson
Asking for the probability that exactly feel secure, more than feel secure and at most feel secure.
Calculator Preview
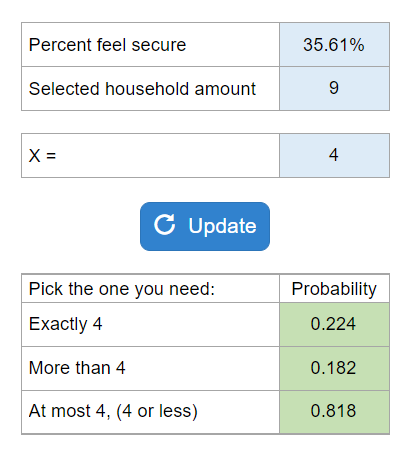
Your numbers will vary.
Asking for the probability that exactly feel secure, more than feel secure and at most feel secure.
Your numbers will vary.
Given the probability of A, P(A), and the probability of B, P(B)… find the probability of A or B if disjoint.
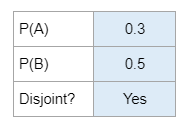
Your numbers will vary.
Car Inspections. Asks to find the probability the car passes, doesn’t pass, both cars pass, and at least one passes.
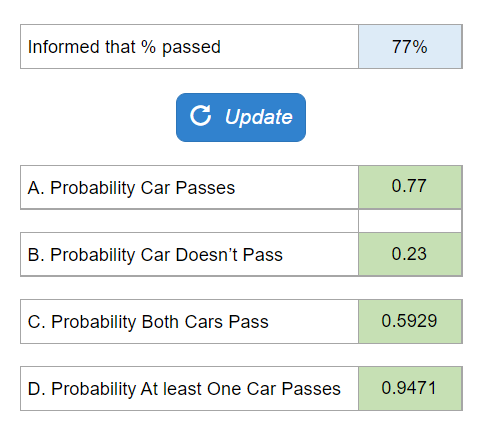
Your numbers will vary.
The % of marketing majors is given, two chosen, and the probability is asked for the first being marketing, not marketing, both marketing, at least one marketing.
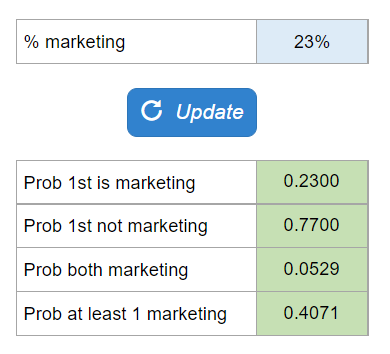
Your numbers will vary.
They give you a contingency table showing registered voters’ opinions on global warming. Asks you to use the table to find the probability that a randomly chosen voter is a republican and thinks global warming is a serious issue. Then asks you to find the probability that a randomly chosen voter is a republican given that they believe global warming is a serious issue. Lastly asks you to find P(Serious Concern|Democratic).
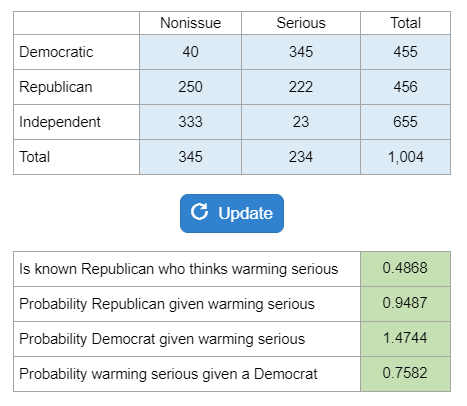
Your numbers will vary.
Asks to find probability any driver detained, chance a driver detained had been drinking, and to find the chance a driver released had been actually been drinking.
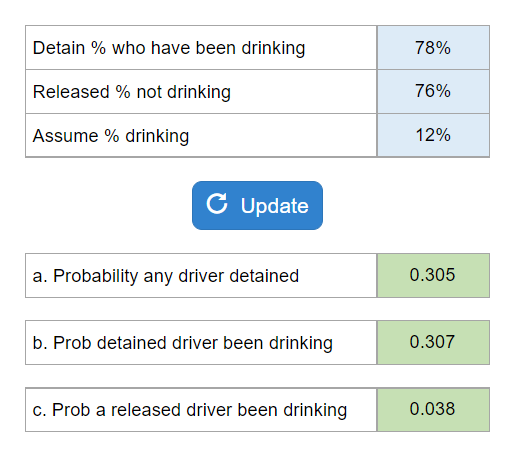
Your numbers will vary.
Asks what the possible values this variable may take on and if it is discrete or continuous.
They give you a horizontal list of # of traffic lights and probabilities. They ask you for a mean and standard deviation.

Your numbers will vary.
Asks if independent, to create a probability model, expected number, and standard deviation.
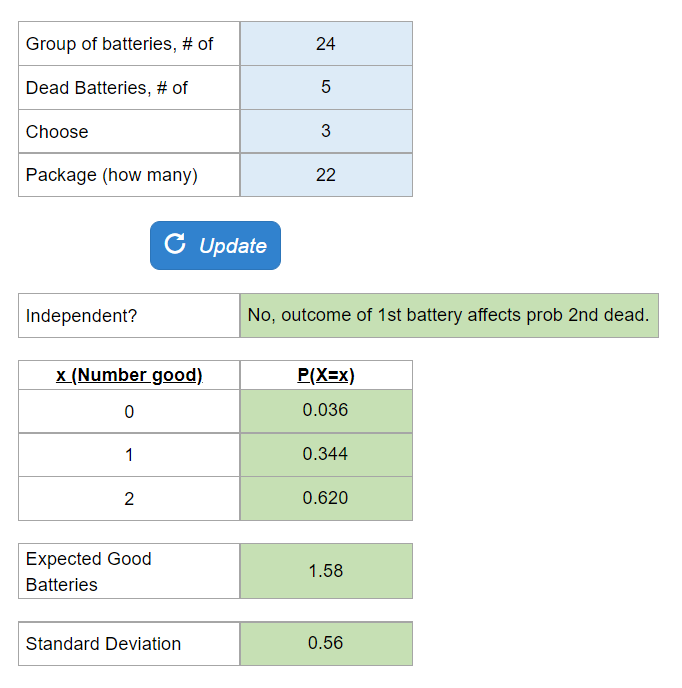
Your numbers will vary.
Asks about the highest 5%, and other percents, and also asks a lowest and middle percents. Also asks to identify the appropriate curve for each question.
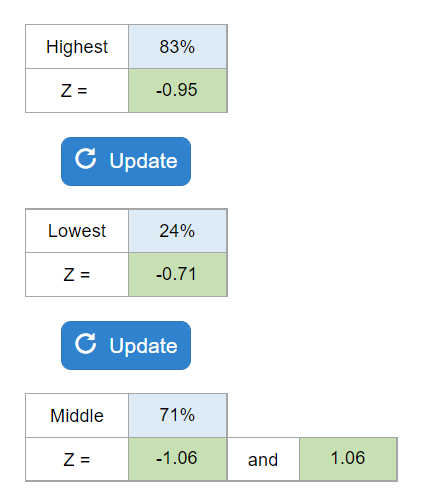
Your numbers will vary.