Problem 4.1.45 – Developing Countries %GDP vs. Growth of Developed Countries
MyStatLab
Pearson
A large scatterplot and various stats are given with questions to follow about assumptions, conditions, the meaning of r2, and cases.
A large scatterplot and various stats are given with questions to follow about assumptions, conditions, the meaning of r2, and cases.
No scatterplot is given. R-squared, intercept, slope, and s are given and a series of questions is asked including the equation of the regression line, the meaning of intercept and slope, a prediction, more or less than predicted, and residual.
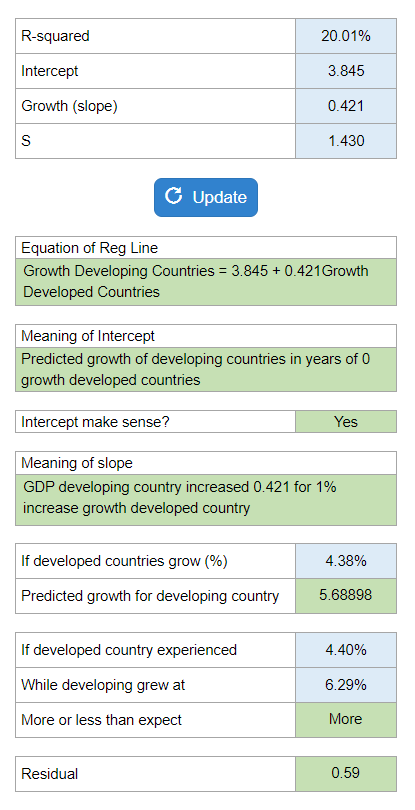
Your numbers will vary.
A scatterplot is presented that shows attendance vs runs scored. Questions asked about correlation the association, and causation.
An equation is given with Flow vs Return and a series of questions asked such as, interpret the intercept and slope, the predicted fund flow, and the residual.
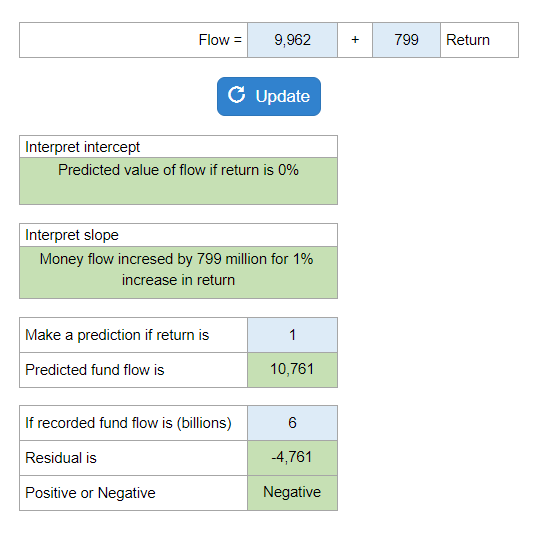
Your numbers will vary.
Three residual plots are given with one question about each plot.
A chart of age and price advertised for Model A cars is given. Questions follow about the association, linear model, correlation, the meaning, variability.
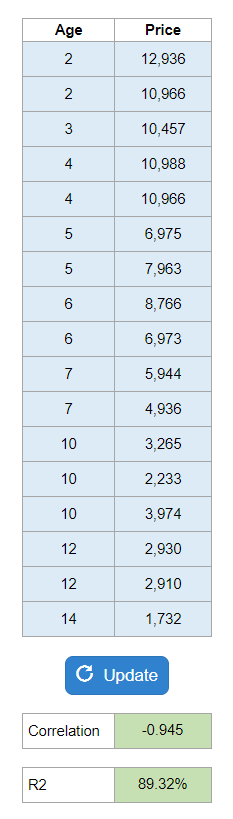
Your numbers will vary.
For a website question about reading license agreements, what kind of sample is it and how much confidence would you place.
Public’s View on Obesity. Identify the population, the population parameter of interest, sampling frame, the sample, the sampling method, and source of bias.
What bias might cause a problem?
Do you think the proposed sampling method is appropriate? 1. Local doctors that do not accept insurance 2. Local businesses anticipate sales to decrease.