3.1.51 – Box Plots of Weekly Gas Prices
MyStatLab
Pearson
Three box plots of gas prices are given with questions on spread, skewness, outliers, and IQR.
Three box plots of gas prices are given with questions on spread, skewness, outliers, and IQR.
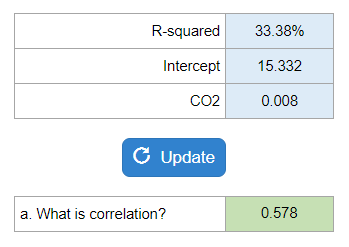
A scatterplot plots is shown with R-squared, intercept, CO2 with questions about meaning of R-squared, equation, meaing of slope, meaning of y-intercept.
Your numbers will vary.
They give you a horizontal list of # of traffic lights and probabilities. They ask you for a mean and standard deviation.

Your numbers will vary.