CH 4 Quiz – MAPE
MyOMLab Operations Management
Heizer, Render and Munson
13th Edition
Given the demand and forecast for each period… find the MAPE
Calculator Preview
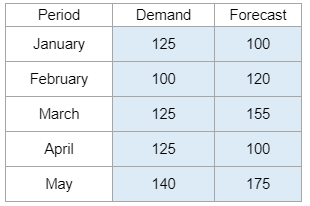
Your numbers will vary.
Given the demand and forecast for each period… find the MAPE
Your numbers will vary.
Given the amount of roses sold each year and weights… using the weighted moving average model, find the forecast for year seven.

Your numbers will vary.
Given alpha, and the demand and forecast for each period… find the forecast for the month.
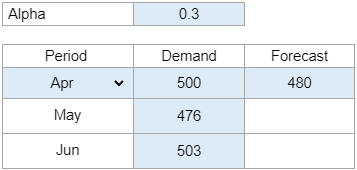
Your numbers will vary.
Determine which forecasting technique yields better results by comparing the Mean Absolute Deviation (MAD) and Mean Absolute Percentage Error (MAPE).
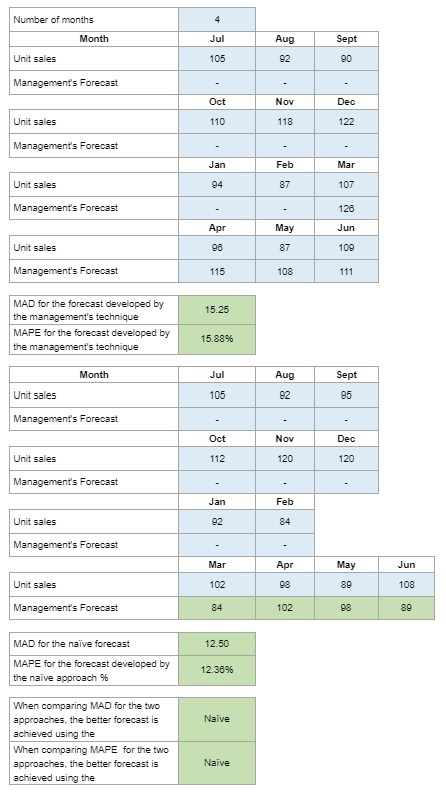
Your numbers will vary.
Determine the best-fit equation, expected ridership, standard error of the estimate, coefficient of correlation, and coefficient of determination.
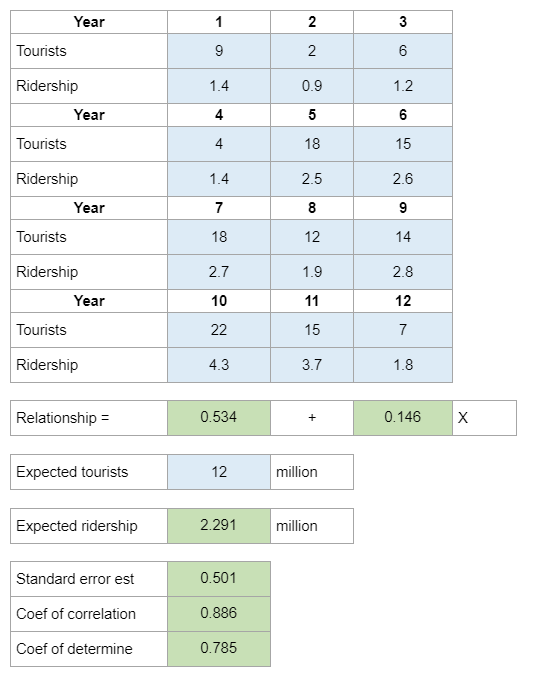
Your numbers will vary.
Calculate the tracking signal given monthly actual and forecasted demand levels.
Your numbers will vary.
Find forecast using moving average, weighted average, and exponential.
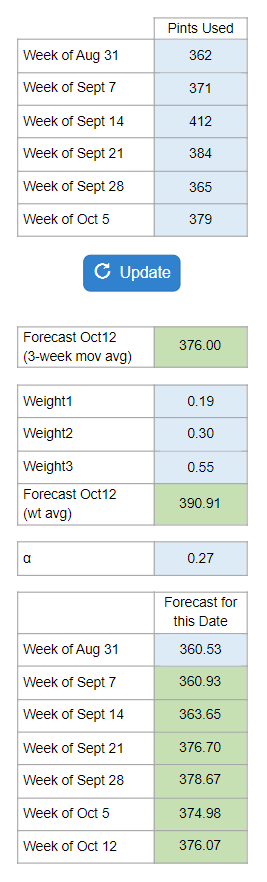
Your numbers will vary.
For residential housing prices in Florida, predict the housing price, and calculate the coefficient of determination.
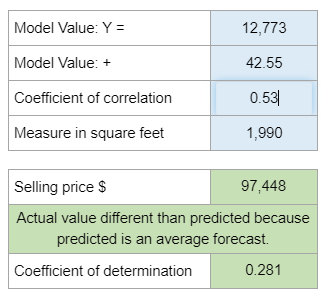
Your numbers will vary.
Estimate the energy use for each quarter in Year 26 (quarters 101-104) based on the given demand trend line equation and seasonal factors.
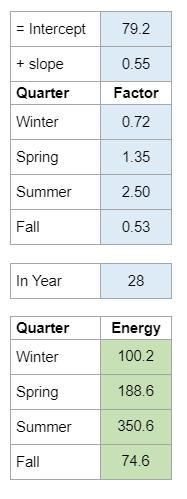
Your numbers will vary.
Calculate the seasonal indices for each season of Lego World’s attendance by using the given data.
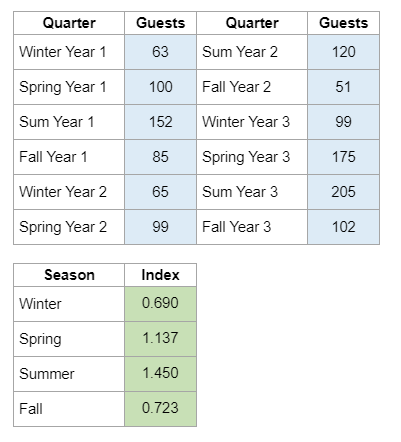
Your numbers will vary.