Chapter 6 – Mary Beth Marrs Complaints, Pareto Chart
MyOMLab Operations Management
Heizer, Render and Munson
13th Edition
Use Pareto Chart to determine the greatest proportion of complaints.
Calculator Preview
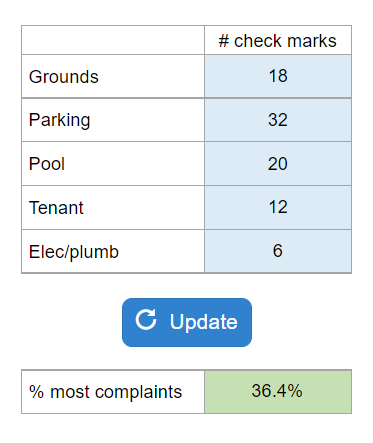
Your numbers will vary.
Use Pareto Chart to determine the greatest proportion of complaints.
Your numbers will vary.
You are given the X bar mean, standard deviation, and desired confidence level. Asks for the upper control limits. This one does not have a sample size given.
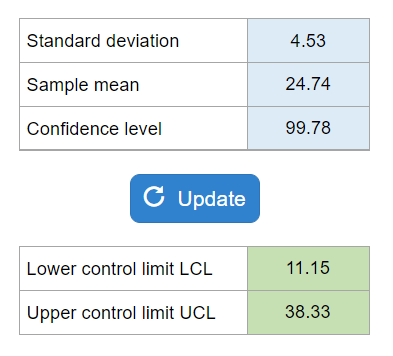
Your numbers will vary.
Calculate the process capability ratio and determine if capable.
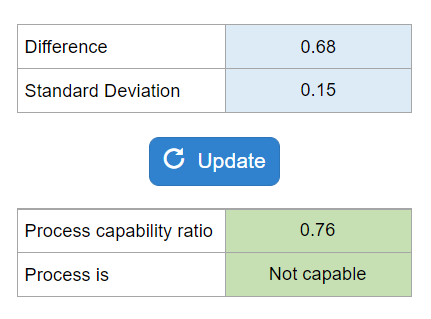
Your numbers will vary.
Calculate Utilization Rate.
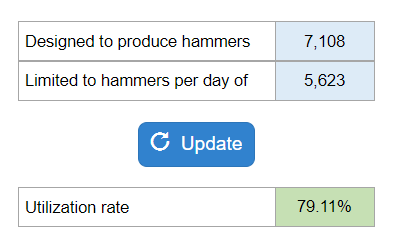
Your numbers will vary.
data on purchase price, contribution margin, repurchase frequency, and defection rate and they ask you for the VLC and the percent change if the rate is changed.
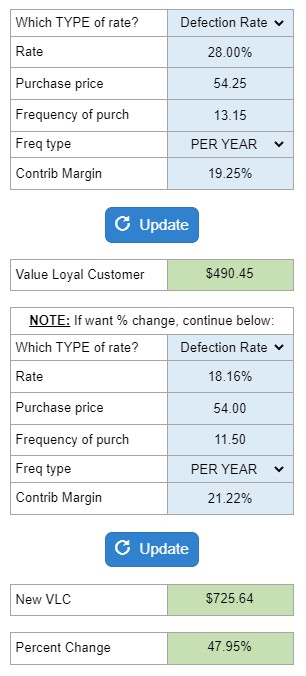
Your numbers will vary.
This is a GENERIC Value of a Loyal Customer (VLC) solver: it works for ANY VLC-type problem! It gives the Value of a Loyal Customer and also gives the percent change (if needed).
Your numbers will vary.
Calculate days for the project to be completed.
Determine the upper and lower control limits for the c-chart measuring incidents of nonconformities in IRS telephone inquiries, and assess the level of variation based on the c-chart.
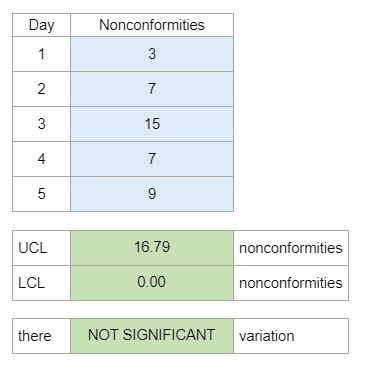
Your numbers will vary.
Gives retention rate, frequency of purchase, cost, etc., asks for the Value of a Loyal Customer
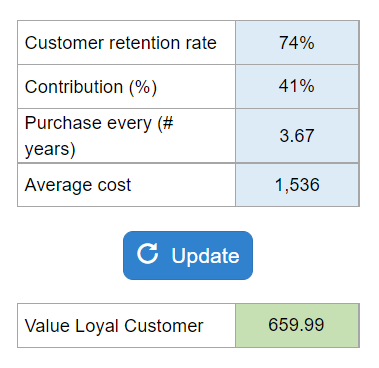
Your numbers will vary.
Given the present value of buying equipment, the real discount rate, and zero inflation, determine the break-even after-tax yearly lease payment.
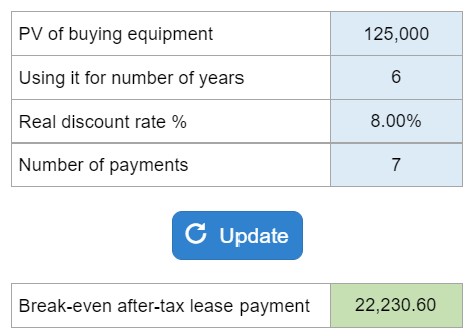
Your numbers will vary.