17.1.7 – A Department of Transportation Report
MyStatLab
Pearson
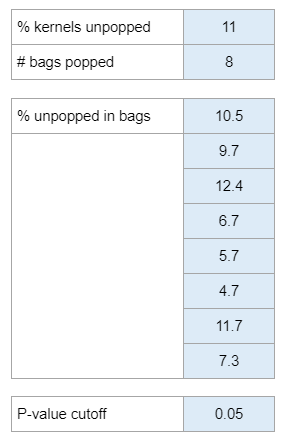
Department of Transportation given percent of flights on time. Asks if Bernoulli.
Calculator Preview
Your numbers will vary.
Department of Transportation given percent of flights on time. Asks if Bernoulli.
Your numbers will vary.
You’re given a sample number of bids from potential buyers in a community. Then you’re given the average loss in home value and standard deviation from the sample. Then you’re given an average home loss value for a year. Then they ask you if the community studied was unusual and to use a t-test to decide if the average loss observed was significantly different from the regional average.
Your numbers will vary.
They ask you to interpret a pie chart and bar chart.
They ask you to choose a table and asks about row or column percentages.
Three box plots of gas prices are given with questions on spread, skewness, outliers, and IQR.
Asking for the discrete probability and the 2 conditions that determine probability distribution.
Gives the percent of adults that like Cashews and then asks exactly, at least, at most.
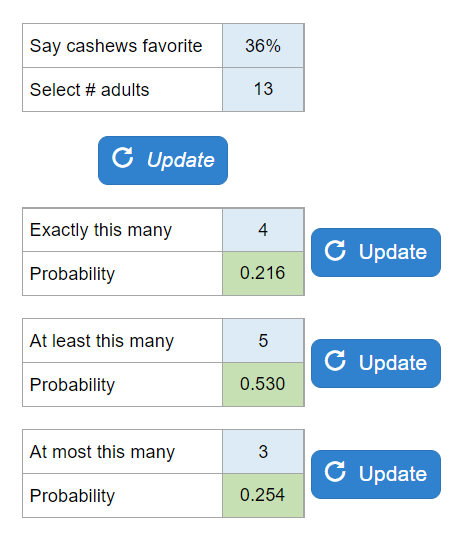
Your numbers will vary.
Asks what truly random means, and what 50/50 means.
The % of defective tires is given with a question about at least one being defective.
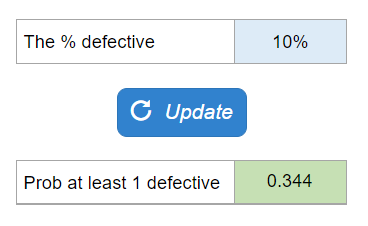
Your numbers will vary.
Car repairs over 1 year. Asks to find the probability of no repairs, one repair, and some repairs.
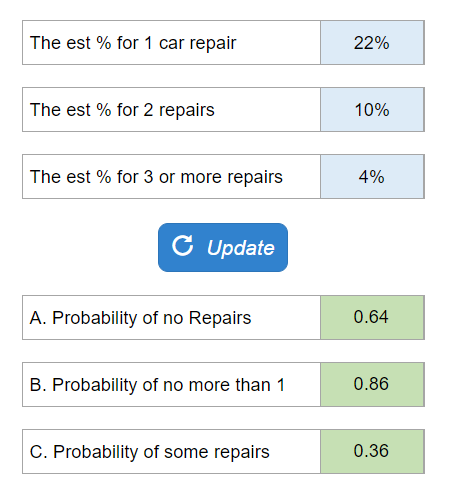
Your numbers will vary.