17.1.7 – A Department of Transportation Report
MyStatLab
Pearson
Department of Transportation given percent of flights on time. Asks if Bernoulli.
Calculator Preview
Your numbers will vary.
Department of Transportation given percent of flights on time. Asks if Bernoulli.
Your numbers will vary.
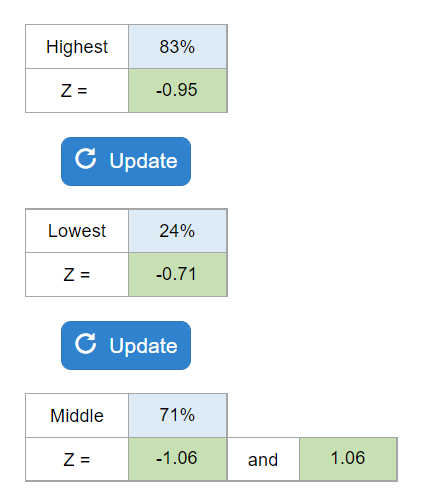
Asks about the highest 5%, and other percents, and also asks a lowest and middle percents. Also asks to identify the appropriate curve for each question.
Your numbers will vary.
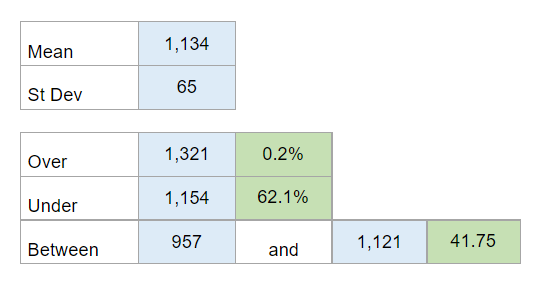
Gives the mean weight of steers and standard deviation. Aks about over a weight, under, and between.
Your numbers will vary.
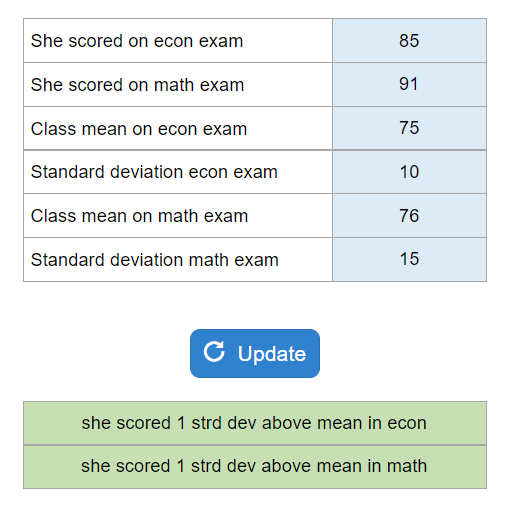
For an MBA student, they are asking which exam the student did relatively better, the econ exam or the math exam.
Your numbers will vary.
Gives a z-score and asks what it means.

Your numbers will vary.
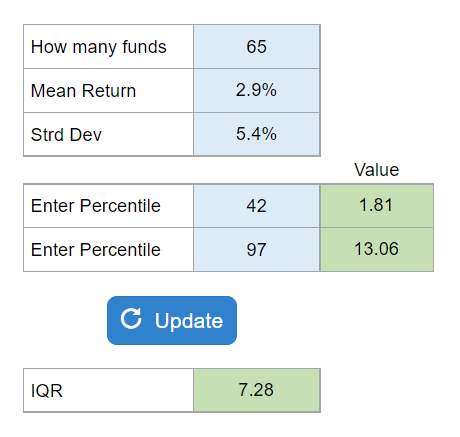
Warning: MyLab has several mutual fund questions. THIS is the one that gives mean return and standard deviation. Asks for percentiles and the IQR only. (The other one asks for more, less, and between)
Your numbers will vary.
Gives the mean and standard deviation for highway driving and asks to draw the model, find the central 95%, 95.7%, more than X mpg, between two mpg, best and worst 2.5% mpg. Uses 68 – 95 – 99.7 rule.
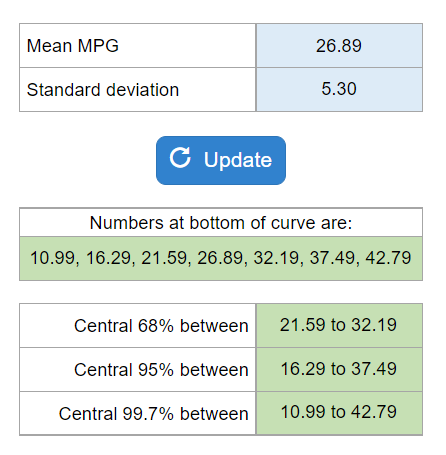
Your numbers will vary.
Two charts are given and asking if Normal Model is appropriate.
Find mean (in minutes) of the sampling distribution of mean commute time, standard deviation of sampling distribution, and describe the shape of the sampling distribution.
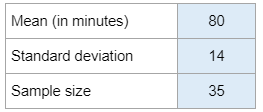
Your numbers will vary.
Given % in default and sample size and ask you to provide the mean of the sampling distribution and standard deviation.
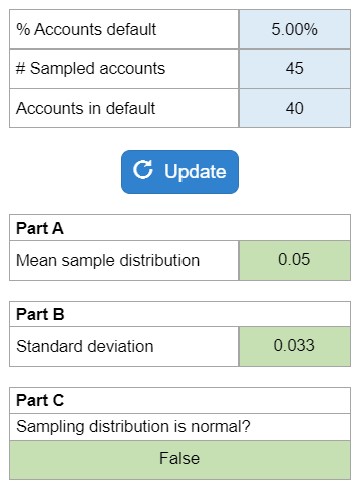
Your numbers will vary.