11.1.21 – T Table Critical Values
MyStatLab
Pearson
Given the T probability % along with the degrees of freedom in two different scenarios… find the critical value that would be used.
Calculator Preview
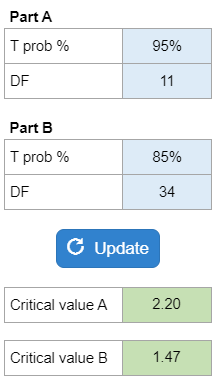
Your numbers will vary.
Given the T probability % along with the degrees of freedom in two different scenarios… find the critical value that would be used.
Your numbers will vary.
Given the sample size, the average amount over speed limit, the standard deviation, and the confidence interval… calculate the margin of error along with determining the sample size that would yield a margin of error less than 1 (or other value).
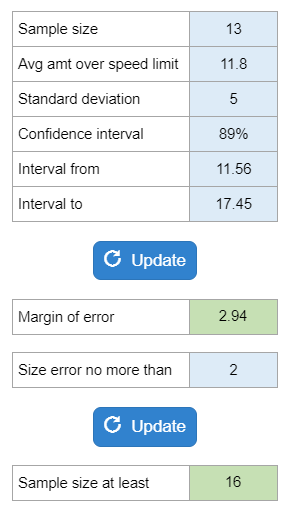
Your numbers will vary.
Given the mean cost of an audit session, the sample size, the sample mean, and the standard deviation… calculate a confidence interval and asks what it means.

Your numbers will vary.
Given the area average, the standard deviation, and the number of healthy adults – find the shape, mean, and standard deviation of the sample distribution.

Your numbers will vary.
Determine if the variance in cereal box fillings exceeds the design specification based on a sample of boxes, using a significance level of 0.05.
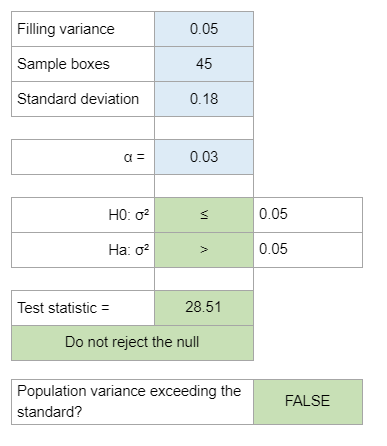
Your numbers will vary.
Compare the unit cost variances between two production departments based on sample data to determine if they differ, using a significance level of 0.10.
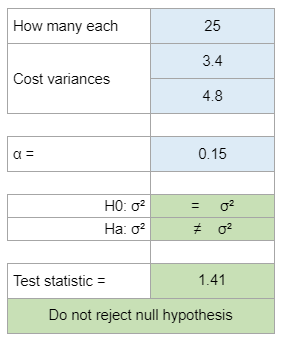
Your numbers will vary.
Estimate and analyze the population variance and standard deviation of the number of rooms occupied per day at a hotel during a particular season based on a sample of 20 days of operation.

Your numbers will vary.
Determine various chi-square distribution values with different degrees of freedom and confidence levels.
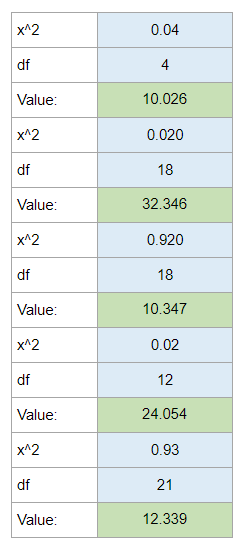
Your numbers will vary.
Calculate the confidence intervals for the population variance and standard deviation based on a sample standard deviation of 5, using appropriate tables.
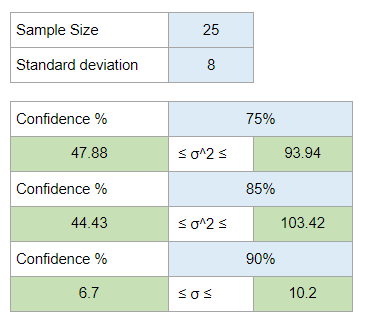
Your numbers will vary.