3.1.51 – Box Plots of Weekly Gas Prices
MyStatLab
Pearson
Three box plots of gas prices are given with questions on spread, skewness, outliers, and IQR.
Three box plots of gas prices are given with questions on spread, skewness, outliers, and IQR.
Is it reasonable to conclude categories were a certain proportion, what percent were from other, select the diagram? Experts Have Solved This Problem Please login or register to access this content.
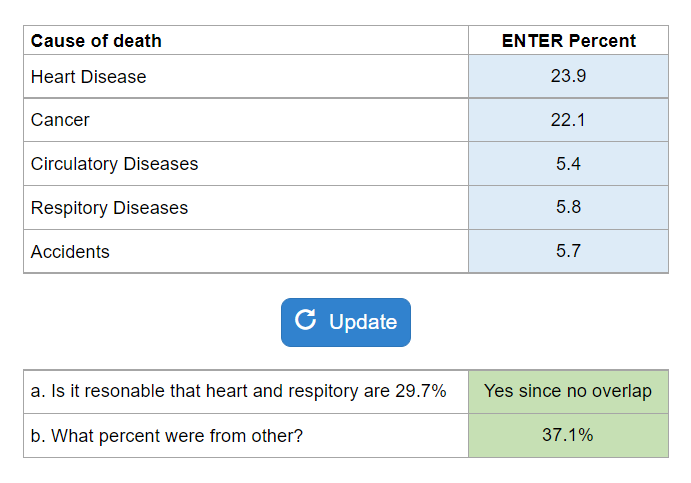
Your numbers will vary.
What % reported a positive change, negative change, and combinations of that question.
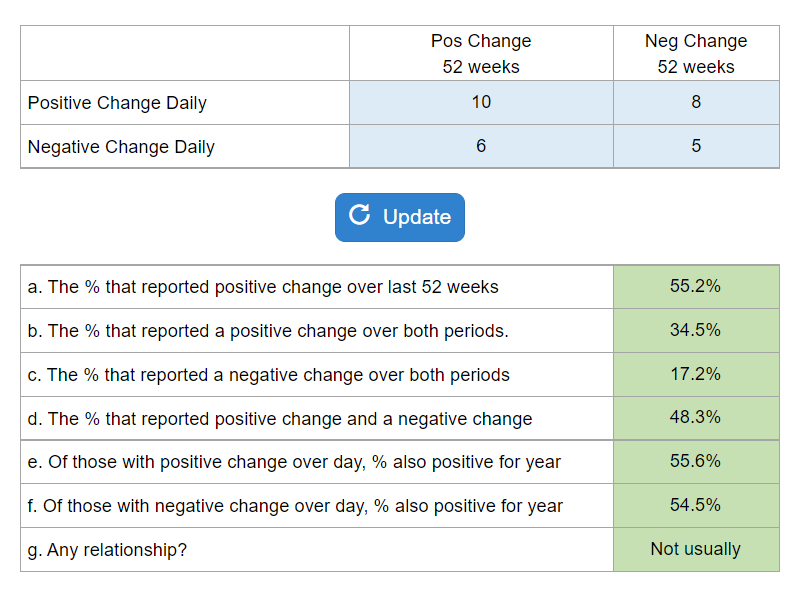
Your numbers will vary.
A histogram is presented with a series of questions about shape, center, spread, asks why the weird shape.
From raw data and a provided histogram, calculate the minimum, maximum, median, Q1, Q3, mean, IQR, range.
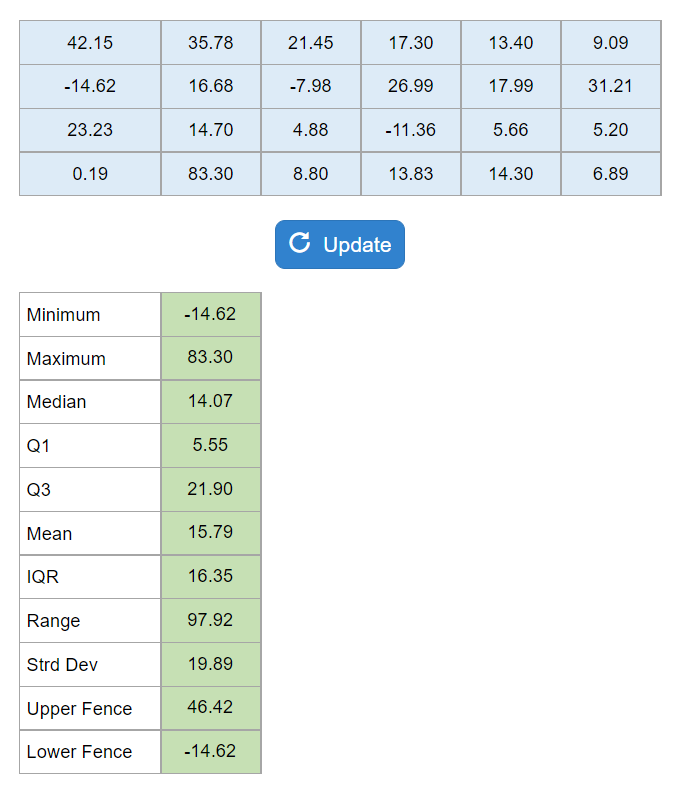
Your numbers will vary.
A long list of data numbers is given and student is asked to make a stem-leaf plot, box plot, answer questions.
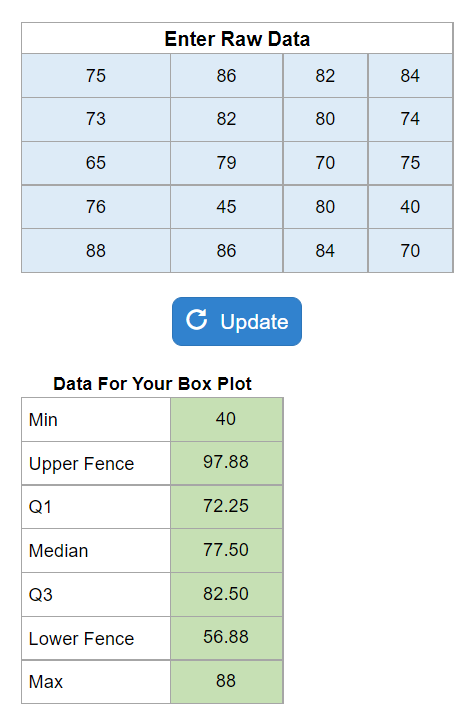
Your numbers will vary.
Three colored boxplots are displayed with various questions about the most expensive, least expensive, etc.
Three histograms are presented, and questions are asked about which did better, shape, uniform, unimodal, symmetric, and then must match a box plot to each.
Find Z-scores for both price and square footage and decide which is more unusual.
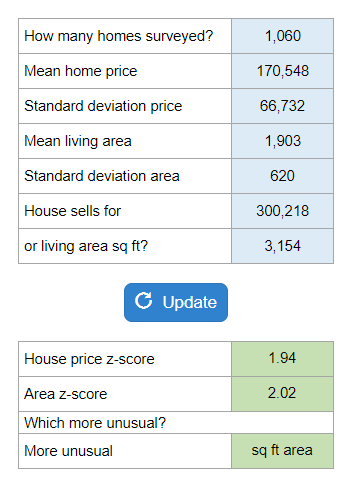
Your numbers will vary.
Summary statistics are given and asked to interpret the data as skewed, symmetric, etc.
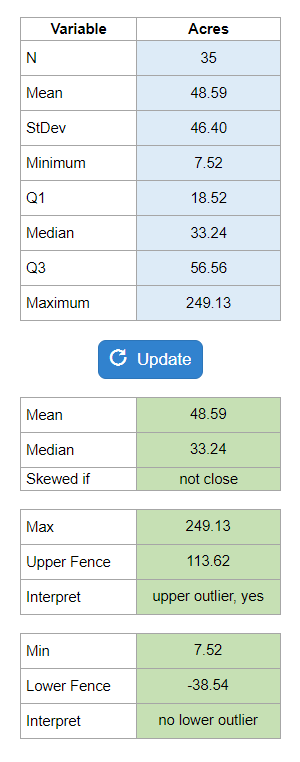
Your numbers will vary.