Problem 4.1.25 – Which Scatterplot Shows Associations
MyStatLab
Pearson
Three scatterplots are given. Questions asked about the association, negative association, positive association, linear association, weak or moderately strong association.
Three scatterplots are given. Questions asked about the association, negative association, positive association, linear association, weak or moderately strong association.
An equation is given to predict sales based on price. Questions follow including explanatory variable, response variable, slope, y-intercept, making a prediction, residual.
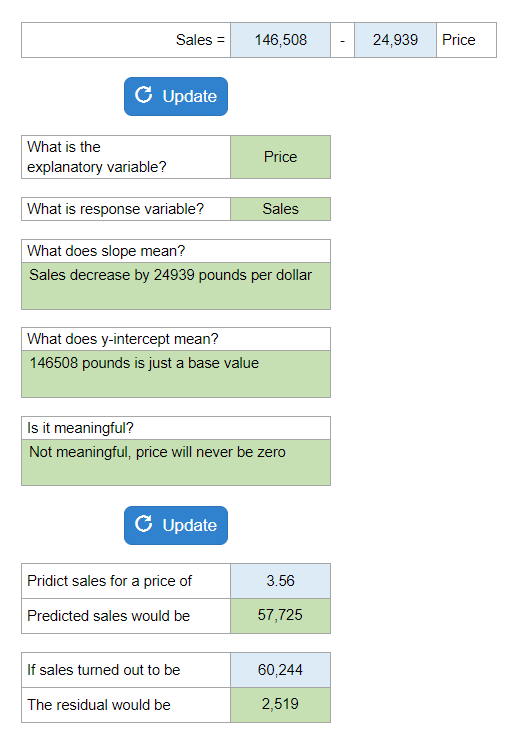
Your numbers will vary.
A large scatterplot and various stats are given with questions to follow about assumptions, conditions, the meaning of r2, and cases.
No scatterplot is given. R-squared, intercept, slope, and s are given and a series of questions is asked including the equation of the regression line, the meaning of intercept and slope, a prediction, more or less than predicted, and residual.
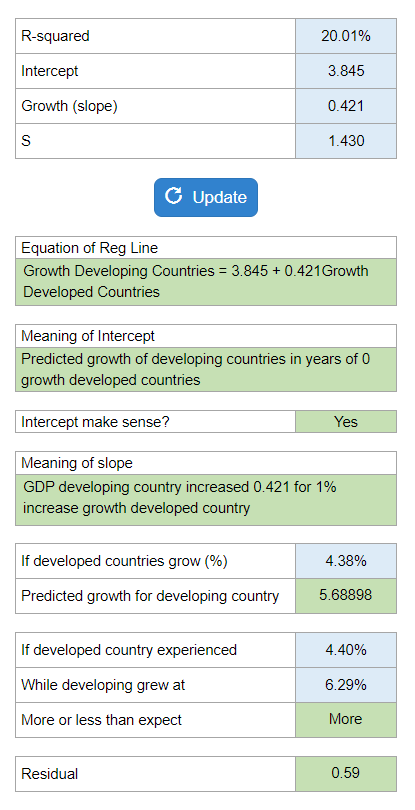
Your numbers will vary.
A scatterplot is presented that shows attendance vs runs scored. Questions asked about correlation the association, and causation.
An equation is given with Flow vs Return and a series of questions asked such as, interpret the intercept and slope, the predicted fund flow, and the residual.
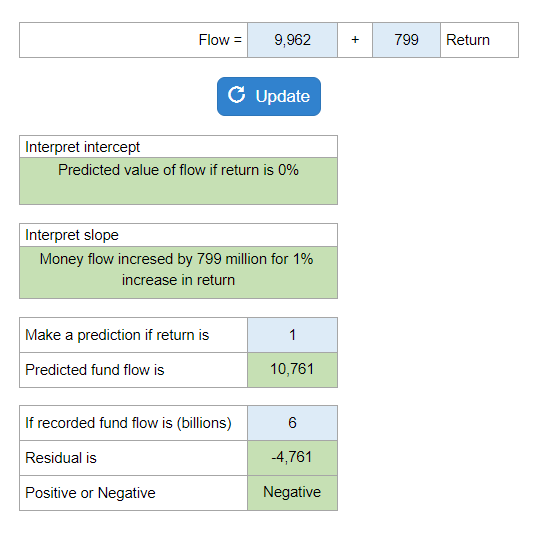
Your numbers will vary.
Three residual plots are given with one question about each plot.
Three scatterplots are given. Questions asked about the association, negative association, positive association, linear association, weak or moderately strong association.