3.1.51 – Box Plots of Weekly Gas Prices
MyStatLab
Pearson
Three box plots of gas prices are given with questions on spread, skewness, outliers, and IQR.
Three box plots of gas prices are given with questions on spread, skewness, outliers, and IQR.
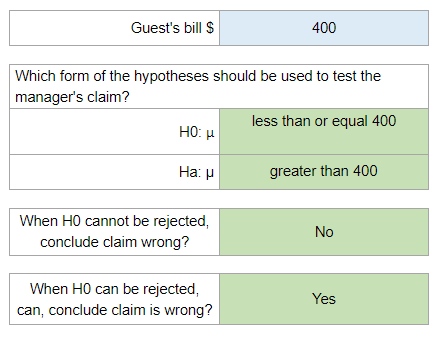
Test the manager’s claim that the mean guest bill for a weekend is $600 or less by selecting the appropriate form of hypothesis. If the null hypothesis cannot be rejected, we cannot conclude that the manager’s claim is wrong. However, if the null hypothesis can be rejected, we can conclude that the manager’s claim is wrong.
Your numbers will vary.
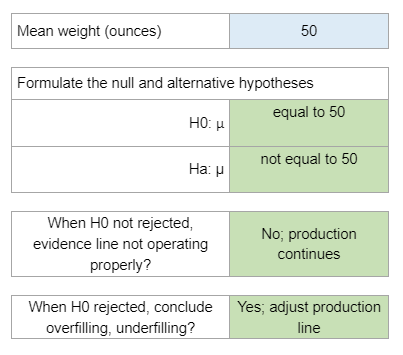
Formulate hypotheses to decide whether to shut down and adjust the production line based on sample data. Determine if evidence suggests the production line is not operating properly or if overfilling or underfilling exists.
Your numbers will vary.
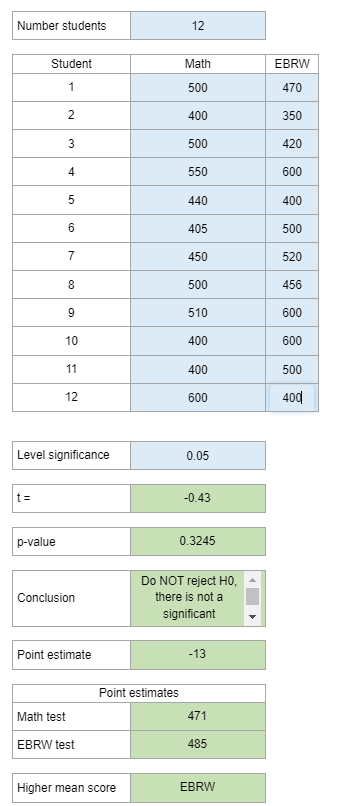
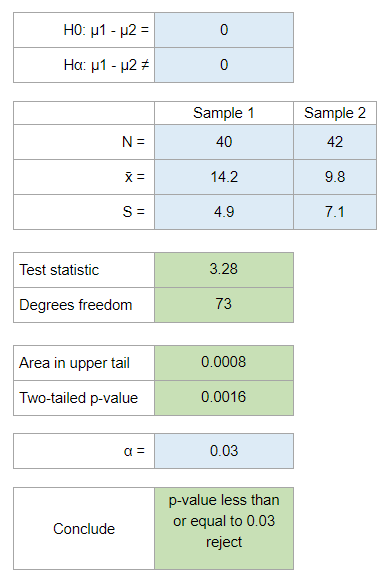
Determine if there is a significant difference between the population mean scores for the SAT math test and the SAT writing test. Calculate the test statistic and p-value, and draw a conclusion based on the results. Additionally, find the point estimate of the difference between the mean scores for the two tests and identify which test reports the higher mean score.
Your numbers will vary.
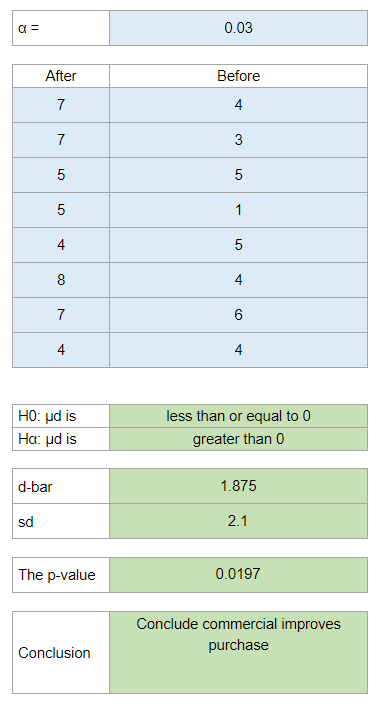
Test the hypothesis to determine if the new television commercial had a statistically significant impact on the mean purchase potential rating.
Your numbers will vary.
Calculate the test statistic, degrees of freedom, and p-value for independent samples taken from two populations, then determine your conclusion based on a significance level of 0.05.
Your numbers will vary.
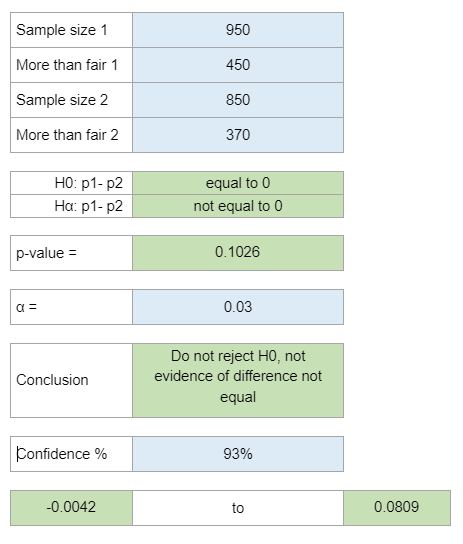
Determine the hypothesis testing conclusion for two independent samples taken from different populations, using a pooled estimator of proportions.
Your numbers will vary.
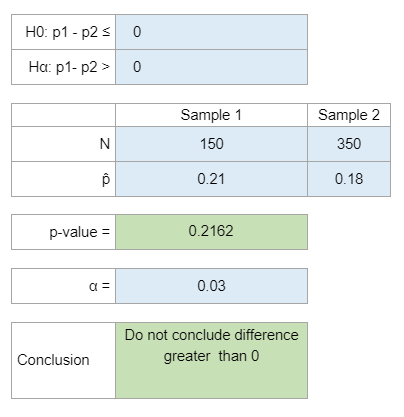
State the hypotheses to test for a significant difference in the population proportions of adults indicating their financial security is more than fair in two different years. Conduct the hypothesis test, calculate the p-value, and determine if there has been a change. Additionally, provide a 95% confidence interval estimate of the difference between the two population proportions.
Your numbers will vary.
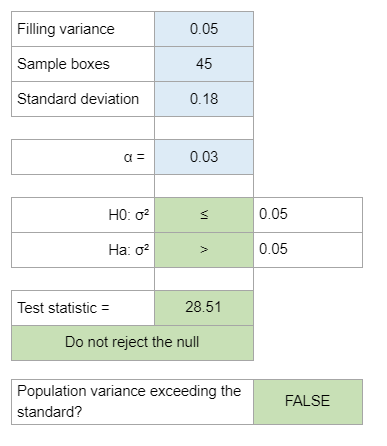
Determine if the variance in cereal box fillings exceeds the design specification based on a sample of boxes, using a significance level of 0.05.
Your numbers will vary.
Compare the unit cost variances between two production departments based on sample data to determine if they differ, using a significance level of 0.10.
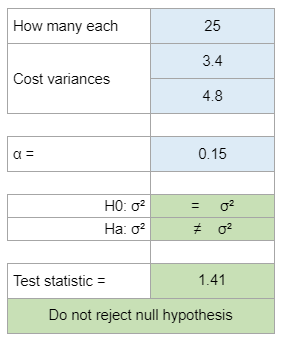
Your numbers will vary.