CH 4 Quiz – MAPE
MyOMLab Operations Management
Heizer, Render and Munson
13th Edition
Given the demand and forecast for each period… find the MAPE
Calculator Preview
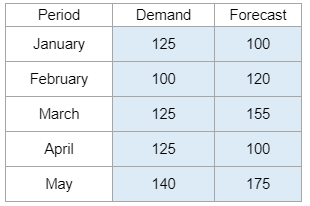
Your numbers will vary.
Given the demand and forecast for each period… find the MAPE
Your numbers will vary.
For residential housing prices in Florida, predict the housing price, and calculate the coefficient of determination.
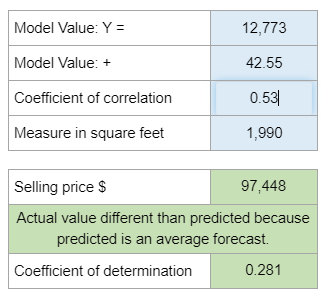
Your numbers will vary.
Estimate the energy use for each quarter in Year 26 (quarters 101-104) based on the given demand trend line equation and seasonal factors.
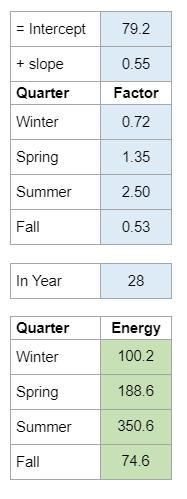
Your numbers will vary.
Calculate the labor productivity, in dollars per labor hour, for a small Flagstaff job shop during the first week of March.
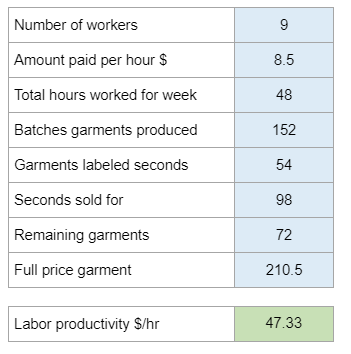
Your numbers will vary.
What are the expected requirements for a good or service?
When given alpha and three months of consecutive data, it gives the the forecast for the three months and the fourth month.
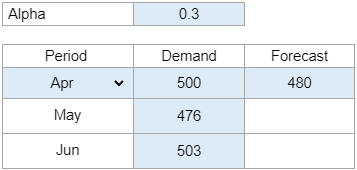
Your numbers will vary.
Asks about Naive Method
Given the amount of chemicals used, the labor cost, miscellanious expenses, and the percentage of which the chemical usage increases… find the percent that productivity has decreased.
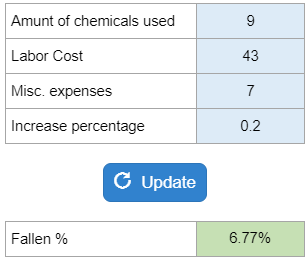
Your numbers will vary.
Given the actual demand, forecasts, and alpha for the current period… use exponential smoothing to determine the forecast for the next period.
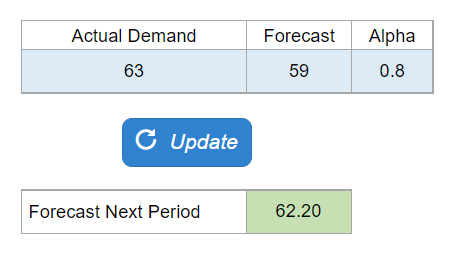
Your numbers will vary.
Given a table with X and Y numbers, develop a linear regression forecasting model, solving for the slope (b) of the line.
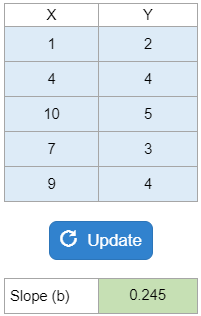
Your numbers will vary.