3.1.51 – Box Plots of Weekly Gas Prices
MyStatLab
Pearson
Three box plots of gas prices are given with questions on spread, skewness, outliers, and IQR.
Three box plots of gas prices are given with questions on spread, skewness, outliers, and IQR.
Asking for the discrete probability and the 2 conditions that determine probability distribution.
Given the coefficient of determination, they ask you to explain what the value or r -squared tells you.
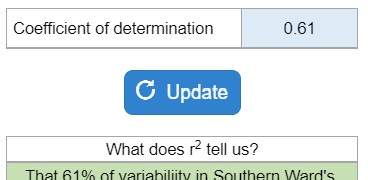
Your numbers will vary.