2.1.25 Structural Design of Oil Tankers
MyStatLab
Pearson
They ask you to interpret a pie chart and bar chart.
They ask you to interpret a pie chart and bar chart.
They ask you to choose a table and asks about row or column percentages.
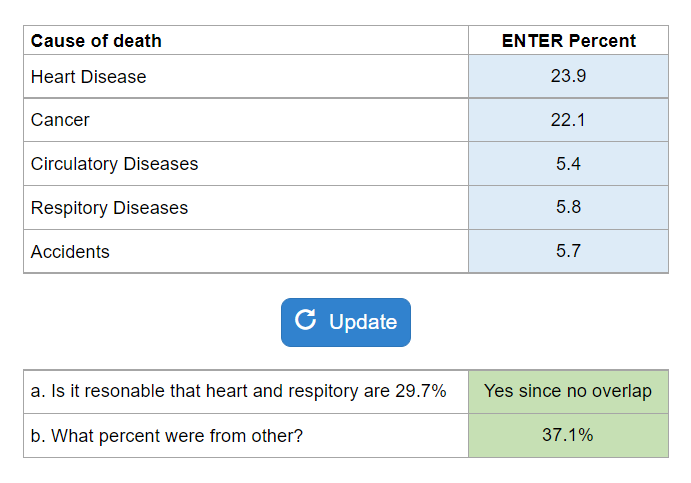
Is the pie chart an appropriate display?
Is it reasonable to conclude categories were a certain proportion, what percent were from other, select the diagram? Experts Have Solved This Problem Please login or register to access this content.
Your numbers will vary.
What do you notice about percentages listed, make a bar chart, is a pie chart effective, write a sentence to summarize.
What do you notice about percentages listed, make a bar chart, is a pie chart effective, write a sentence to summarize.
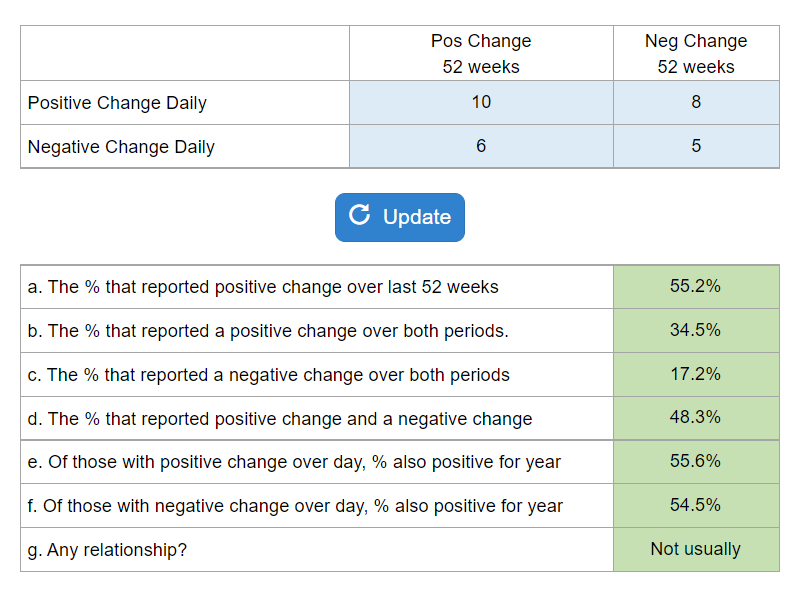
What % reported a positive change, negative change, and combinations of that question.
Your numbers will vary.