5.2.21 – The % of Households that Say they Would be Secure
MyStatLab
Pearson
Asking for the probability that exactly feel secure, more than feel secure and at most feel secure.
Calculator Preview
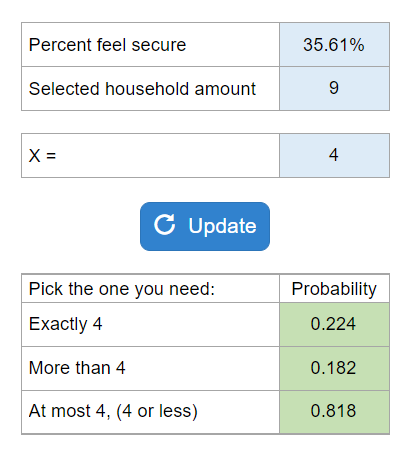
Your numbers will vary.
Asking for the probability that exactly feel secure, more than feel secure and at most feel secure.
Your numbers will vary.
Asks to find probability any driver detained, chance a driver detained had been drinking, and to find the chance a driver released had been actually been drinking.
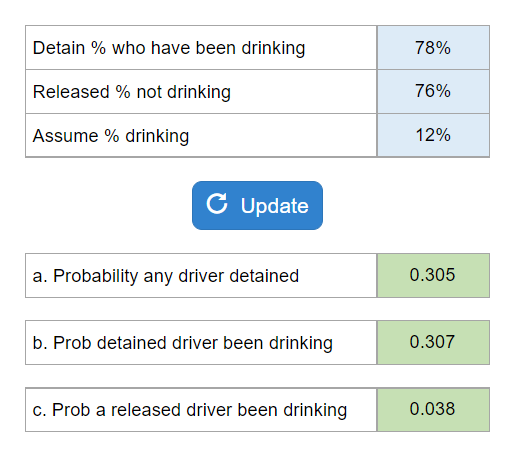
Your numbers will vary.
They give you a horizontal list of # of traffic lights and probabilities. They ask you for a mean and standard deviation.

Your numbers will vary.
Asks if independent, to create a probability model, expected number, and standard deviation.
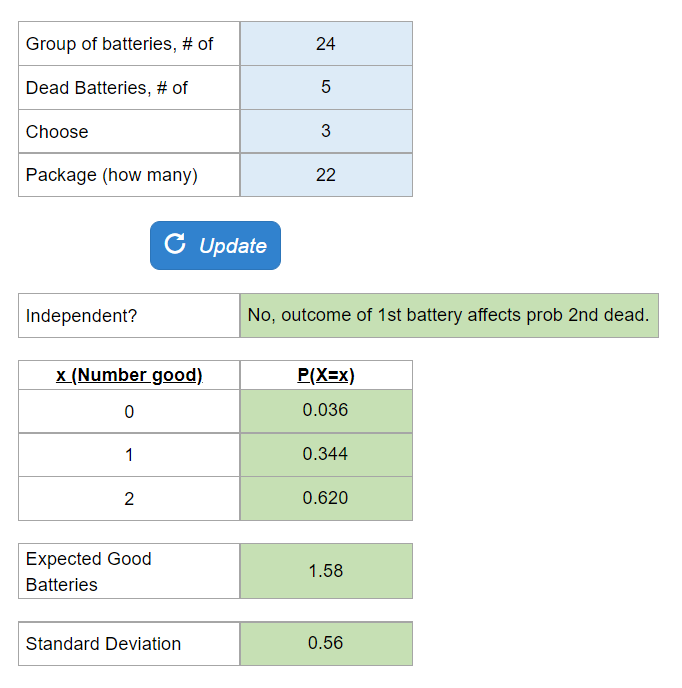
Your numbers will vary.
Find the upper and lower control limits for the number of unsatisfied patients.

Your numbers will vary.
For a number of trading days, gives the mean stock price and standard deviation. Asks above a certain price, below, between, and which is more unusual.
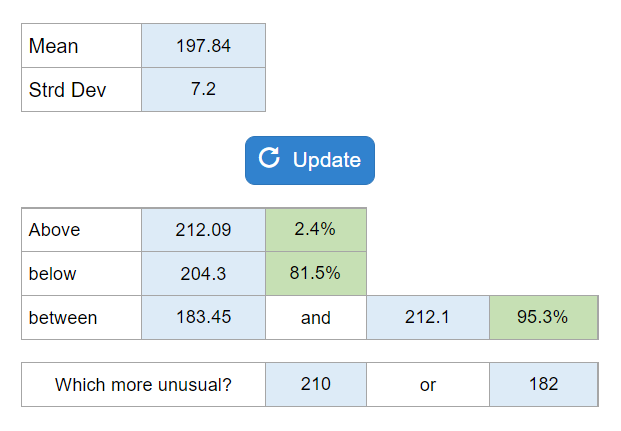
Your numbers will vary.
Gives mean and a percent. Asks for standard deviation and the curve. Then gives standard deviation and a percent and asks for the mean and the curve.
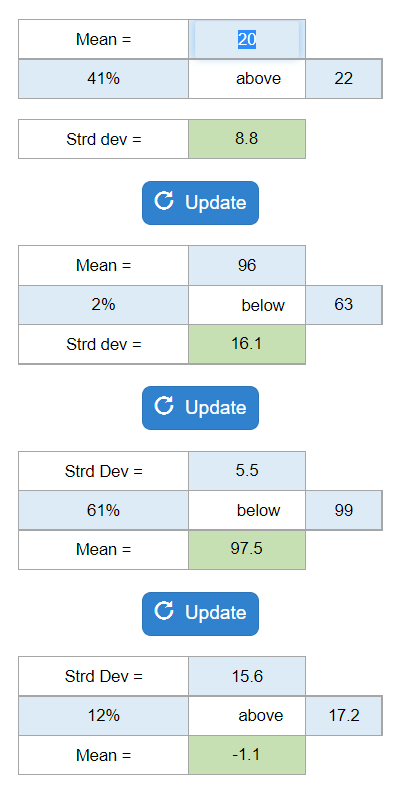
Your numbers will vary.
They give a mean and a standard deviation and ask to choose the appropriate bell curve and ask what percent is over a value, between, IQR, and highest X percent.
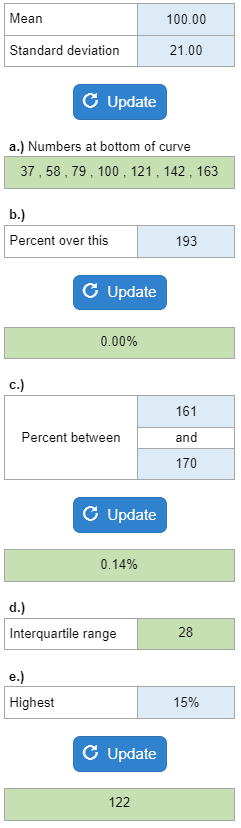
Your numbers will vary.
For a number of trading days, gives the mean stock price and standard deviation. Asks above a certain price, below, between, and which is more unusual.
Your numbers will vary.
Asks you to find the accumulated investment by the end of year 3 for Options 1, 2, and 3.

Your numbers will vary.