Problem 8.09 – Stock R & Stock S
Fundamentals of Financial Management, Concise
Brigham and Houston
09th Edition, 10th Edition, and 11th Edition
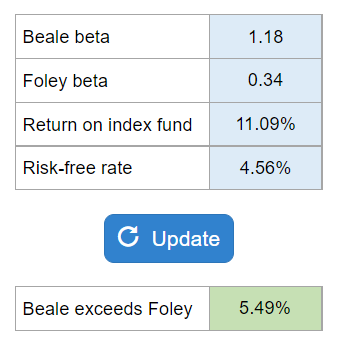
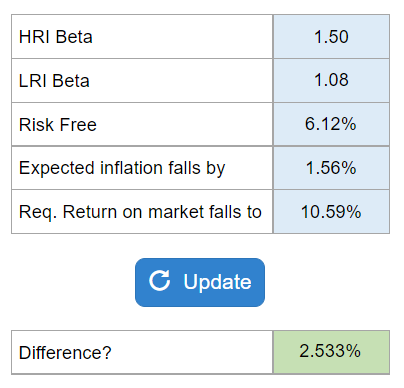
How much does the riskier stock’s required return exceed the less risky one?
Calculator Preview
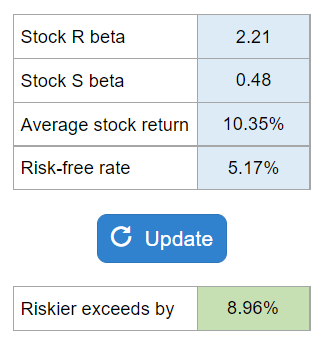
Your numbers will vary.