11.1.25-T – Gasoline Prices Confidence Interval
MyStatLab
Pearson
Given statistics of the price of gasoline taken from a sample… determine the confidence interval in three different scenarios.
Calculator Preview
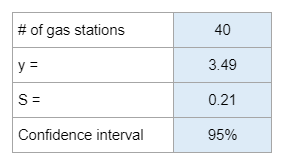
Your numbers will vary.
Given statistics of the price of gasoline taken from a sample… determine the confidence interval in three different scenarios.
Your numbers will vary.
They give you the percent of adults that have high cholesterol, the average cholesterol levels, the standard deviation, and the number in the sample, and ask you to calculate the mean and the standard deviation of the sample distribution.
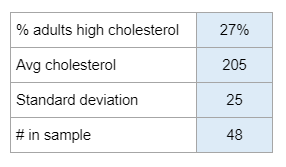
Your numbers will vary.
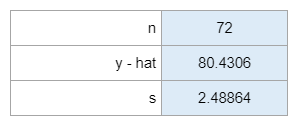
Given the sample size, the daily average, and the standard deviation… construct a confidence interval.
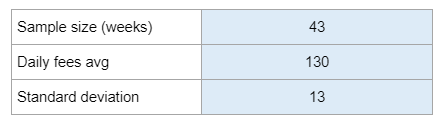
Your numbers will vary.
Given the percent of adults with high cholesterol, the average and standard deviation of cholesterol levels, and the sample size… calculate the probability of the mean cholesterol of the sample to be in four different scenarios.
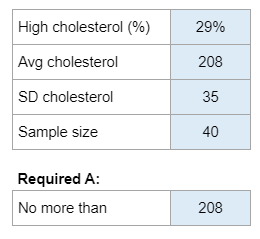
Your numbers will vary.
Given the average wind speeds, how often it is recorded, the total readings, the average speed, and the standard deviation… determine if all conditions are met and then calculate a confidence interval.
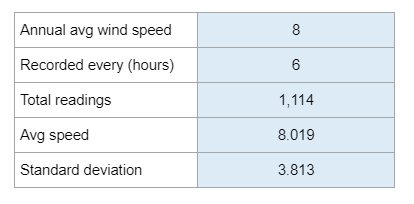
Your numbers will vary.
Given the average age of the consumer years ago along with what they believed the average age will do… determine the null and alternative hypothesis, whether the assumptions are satisfied, and the p-value.
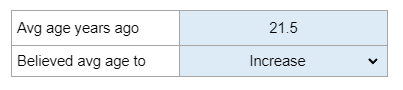
Your numbers will vary.
Given the sample size, the mean, the standard deviation, and the estimated mean age… run a hypothesis test determining the null, test statistic, p-value, and lastly whether to reject or fail to reject.
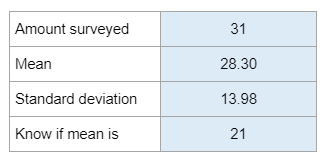
Your numbers will vary.
Given the sample size, the mean, the standard deviation, and the amount they want to compare to… determine the null, the test statistic, the p-value, and lastly determine whether to reject or fail to reject the null.
Your numbers will vary.
Given the sample size, the mean, the standard deviation, and the margin of error on a confidence interval… determine the sample size that would be needed to reach predetermined margins of error.
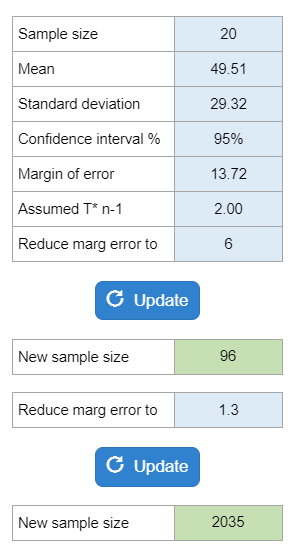
Your numbers will vary.
You’re given a histogram and summary statistics for flights leaving on time each month from 2001-2006 and told there is no evidence of a trend. Then you’re asked if the independence assumptions are met, if the randomization condition is met or is it suitably representative, if the 10% condition is met, and if the nearly normal condition is met. Next, you’re given a confidence level and have to find and interpret the interval.
Your numbers will vary.