Problem 2.1.36 – Income Breakdown of Internet Users Surveyed
MyStatLab
Pearson
Find the conditional distribution of both wireless and nonwireless (other). Create a graph. Do you see any differences?
Calculator Preview
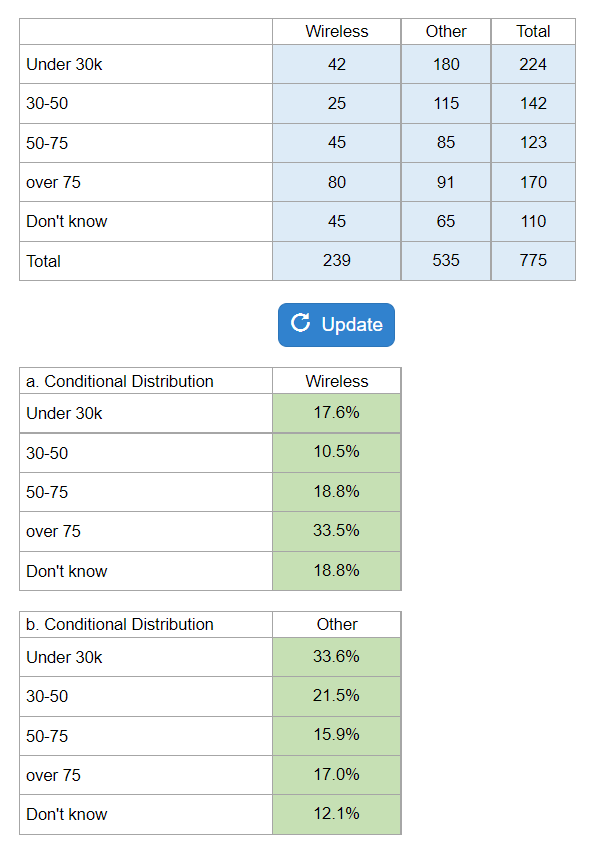
Your numbers will vary.
Find the conditional distribution of both wireless and nonwireless (other). Create a graph. Do you see any differences?
Your numbers will vary.
Percent of MBA from Region, Two-years and evening from region, marginal distribution, conditional distribution, independent.
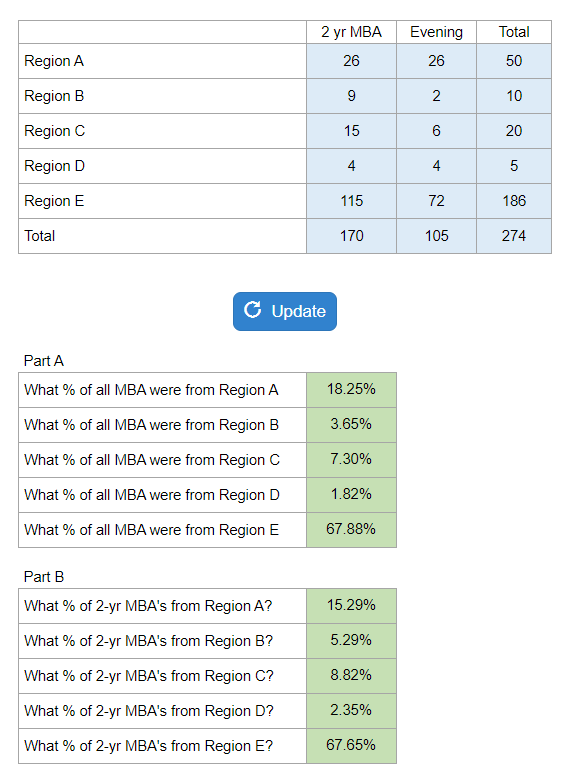
Your numbers will vary.
What % admitted, higher or lower for females, compare, program admission rates.
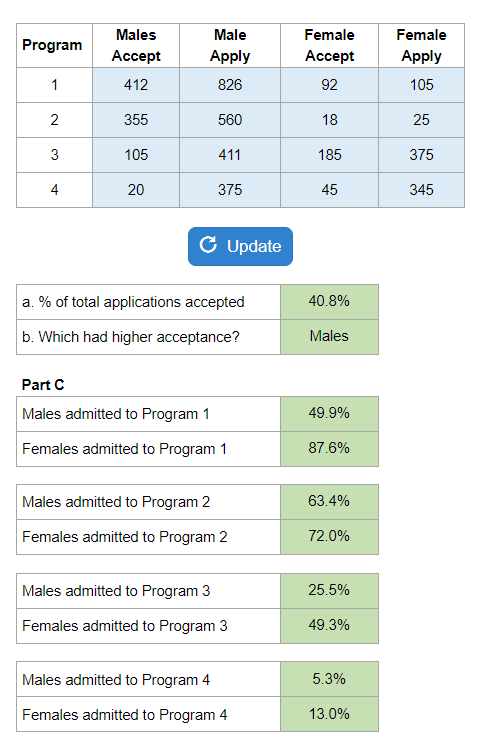
Your numbers will vary.
A large table is presented with years and age ranges for numbers that attended the movies. Many questions asked such as: percent of certain age groups that attended in certain years. Bar charts and asked for patterns.

Your numbers will vary.