7.3.14 – Charts Display Data Price Index Consumer Goods
MyStatLab
Pearson
Two charts are given and asking if Normal Model is appropriate.
Two charts are given and asking if Normal Model is appropriate.
For a number of trading days, gives the mean stock price and standard deviation. Asks above a certain price, below, between, and which is more unusual.
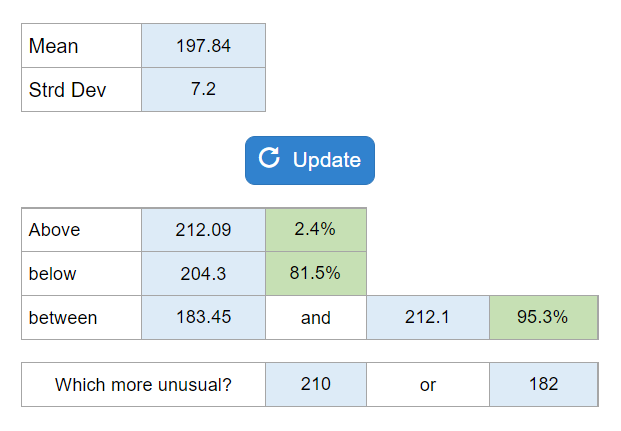
Your numbers will vary.
Asks what problem this would present if bad debts material and significant
Asks if assembly line is repetitive process
Characteristics of ASRS.
Known as what?
Check figures (only) for the Chapter 7 quiz.
Asks about the CECL Model and what it allows a company to do…
Given the number of inspectors, test per hour, and the amount that each inspector can inspect in the hour… find the utilization.
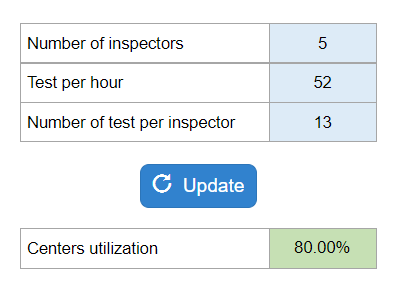
Your numbers will vary.
Find the crossover point and possibly which option should be selected based on given demand.
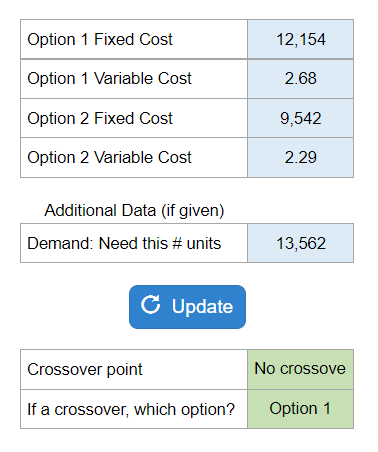
Your numbers will vary.