Problem 2.1.23 – Researchers Asked Small Business How Difficult or Easy
MyStatLab
Pearson
What do you notice about percentages listed, make a bar chart, is a pie chart effective, write a sentence to summarize.
What do you notice about percentages listed, make a bar chart, is a pie chart effective, write a sentence to summarize.
What do you notice about percentages listed, make a bar chart, is a pie chart effective, write a sentence to summarize.
What % reported a positive change, negative change, and combinations of that question.
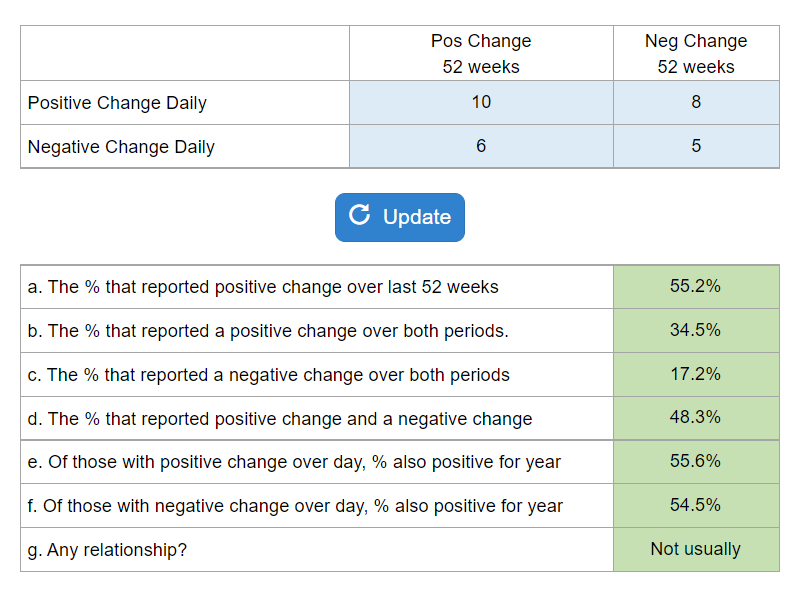
Your numbers will vary.
Find the conditional distribution of both wireless and nonwireless (other). Create a graph. Do you see any differences?
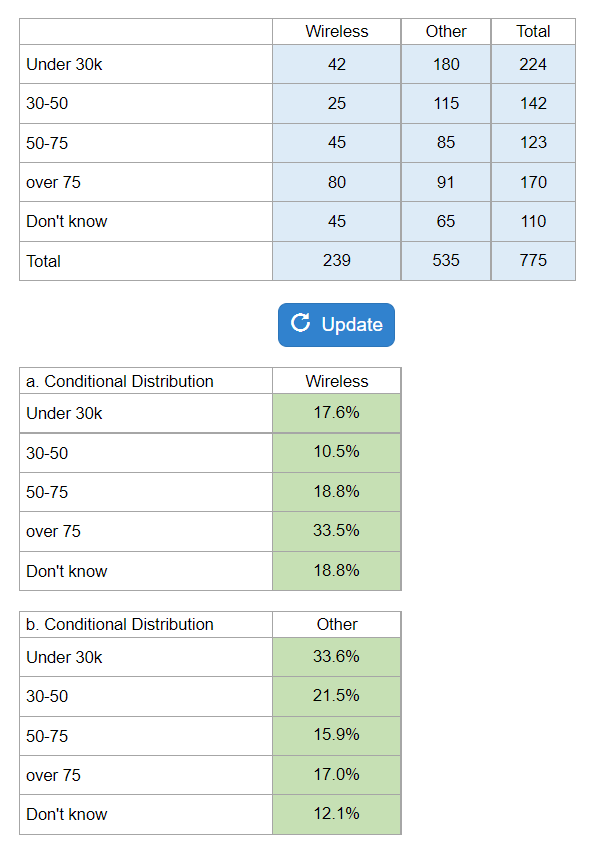
Your numbers will vary.
Percent of MBA from Region, Two-years and evening from region, marginal distribution, conditional distribution, independent.
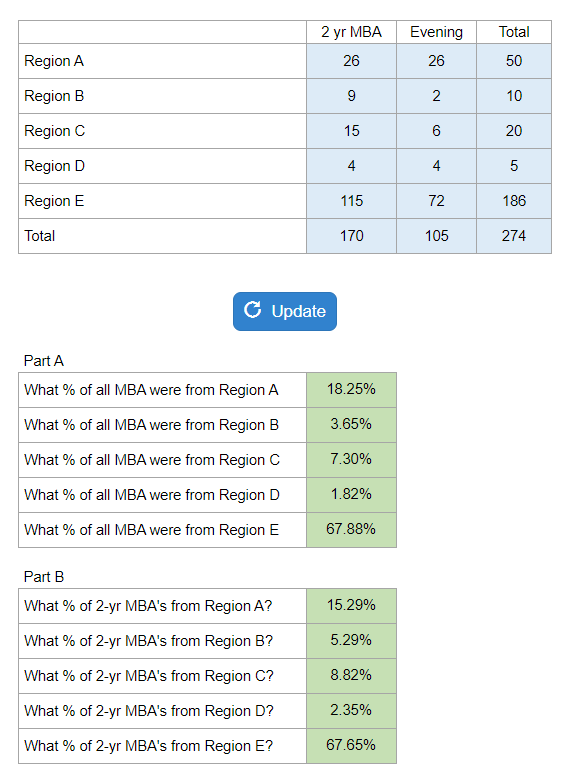
Your numbers will vary.
What % admitted, higher or lower for females, compare, program admission rates.
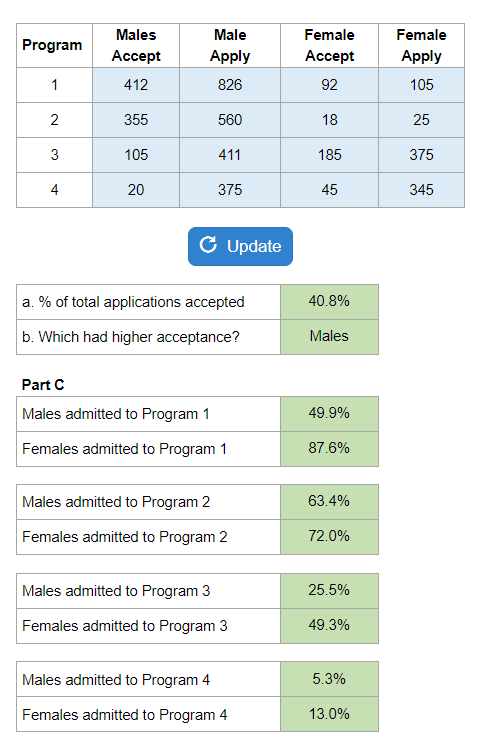
Your numbers will vary.
A large table is presented with years and age ranges for numbers that attended the movies. Many questions asked such as: percent of certain age groups that attended in certain years. Bar charts and asked for patterns.

Your numbers will vary.
They give you a chart of responses within age groups and ask you to complete the contingency table along with calculating the relative frequencies.
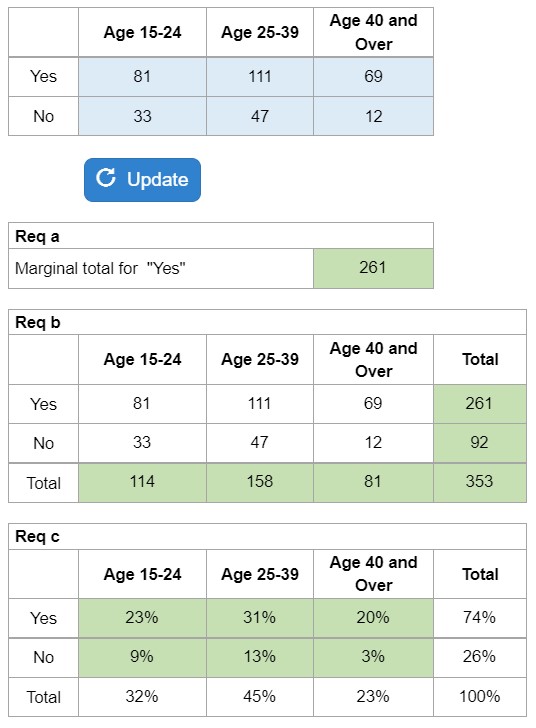
Your numbers will vary.
Each year IRS randomly audits tax returns. Ask you to determine the probabilities of different events for the Husband and Wife.
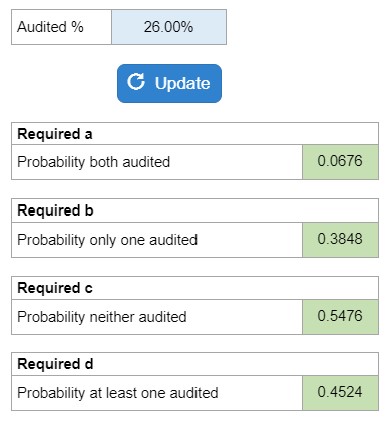
Your numbers will vary.