3.1.51 – Box Plots of Weekly Gas Prices
MyStatLab
Pearson
Three box plots of gas prices are given with questions on spread, skewness, outliers, and IQR.
Three box plots of gas prices are given with questions on spread, skewness, outliers, and IQR.
They give you the probabilities of four outcomes to an experiment and ask you to determine if the probability assignments are valid.
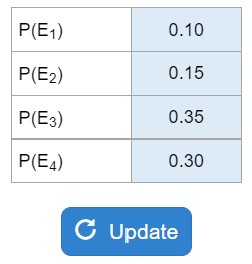
Your numbers will vary.
Asking for the discrete probability and the 2 conditions that determine probability distribution.
A scatterplot plots is shown with R-squared, intercept, CO2 with questions about meaning of R-squared, equation, meaing of slope, meaning of y-intercept.
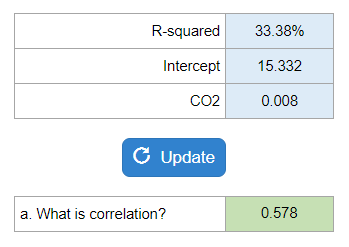
Your numbers will vary.
Gives the percent of adults that like Cashews and then asks exactly, at least, at most.
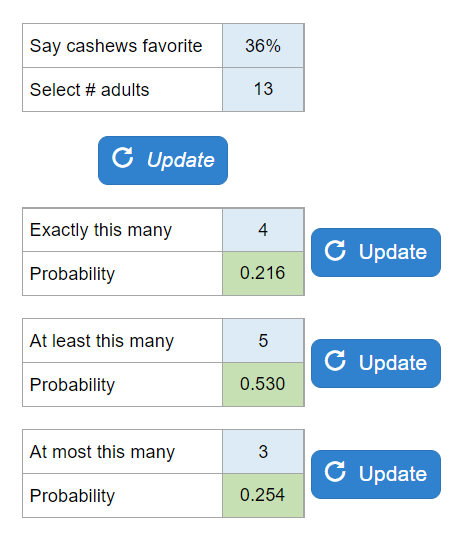
Your numbers will vary.
x grams of a compound is dissolved in x grams of water. What is the q for water and the ∆H°?
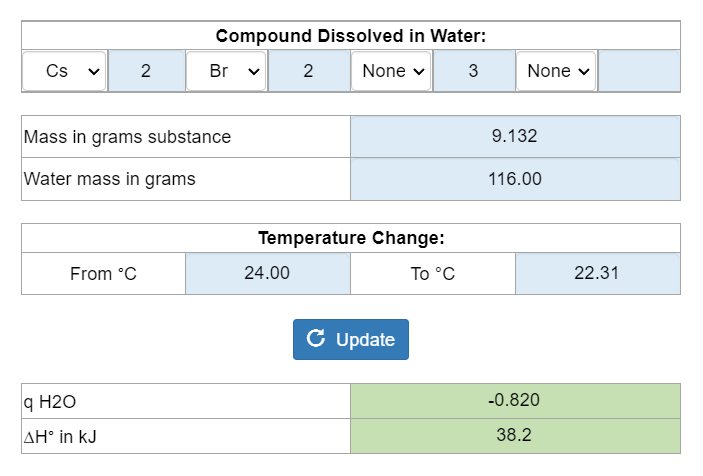
Your numbers will vary.
What is the atomic mass of the element?
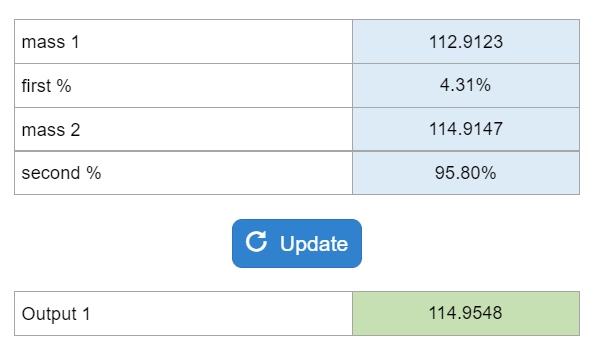
Your numbers will vary.
Asks what truly random means, and what 50/50 means.
The % of defective tires is given with a question about at least one being defective.
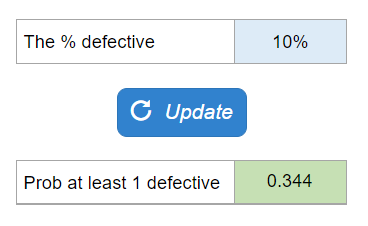
Your numbers will vary.
Car repairs over 1 year. Asks to find the probability of no repairs, one repair, and some repairs.
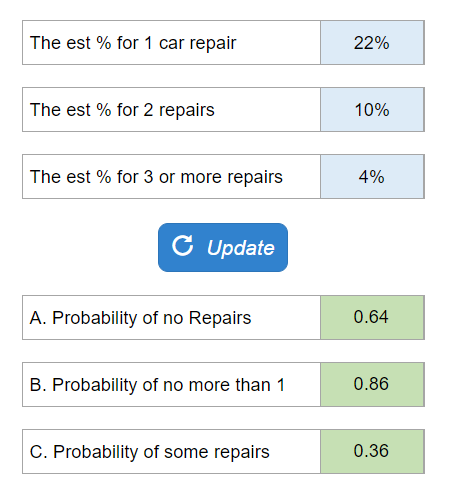
Your numbers will vary.