Problem 3.1.53 – Boxplots Display Case Prices of Varieties of Grapes
MyStatLab
Pearson
Three colored boxplots are displayed with various questions about the most expensive, least expensive, etc.
Three colored boxplots are displayed with various questions about the most expensive, least expensive, etc.
Three histograms are presented, and questions are asked about which did better, shape, uniform, unimodal, symmetric, and then must match a box plot to each.
Find Z-scores for both price and square footage and decide which is more unusual.
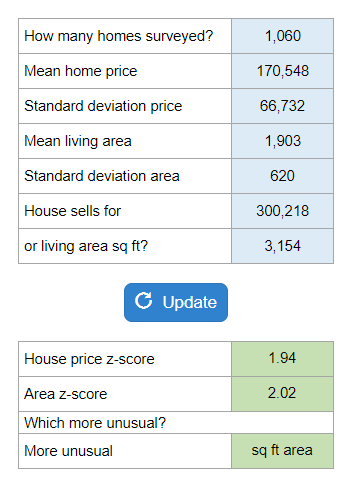
Your numbers will vary.
Given how much you expect to have in the given year(s), and the interest rate… how much can you borrow today?
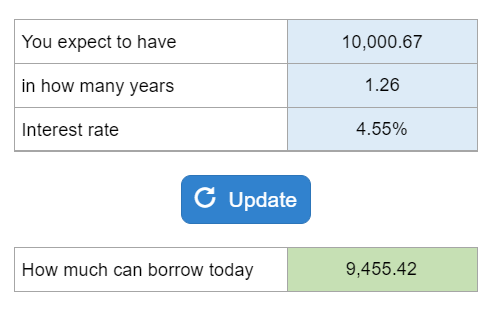
Your numbers will vary.
How long did it take to pay off its suppliers?
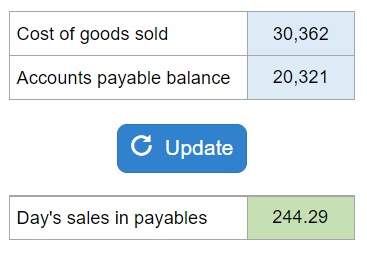
Your numbers will vary.
Given dividends paid and retained earnings in the current year and prior year… solve for net income.
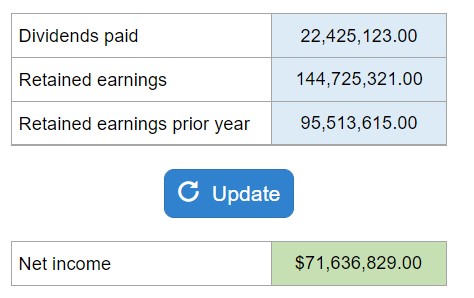
Your numbers will vary.
Given a debt-equity ratio, return on assets, and total equity, calculate the equity multiplier, return on equity, and net income.
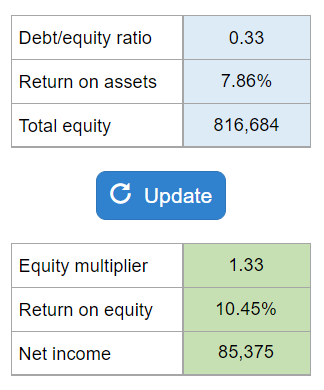
Your numbers will vary.
Determine the net capital inflow or outflow for China in various years, and identify whether the flow is an inflow or an outflow. In part 2, you are asked to determine the sum of groups A and B for various years etc. This solver solves all the China problems from chapter 3. All you have to do is repeatedly select different years from the dropdown depending on which year is asked for.

Your numbers will vary.
Given the loan and two interest rates…. determine how much you will save in interest this year.
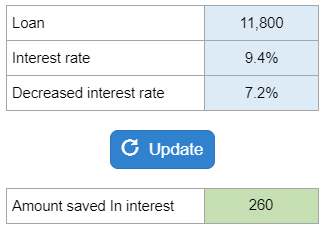
Your numbers will vary.
Determine the enterprise value-EBITDA multiple for a company given its market value of equity, cash, debt, EBIT, and total depreciation and amortization.
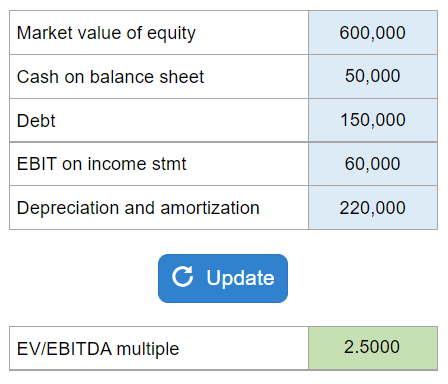
Your numbers will vary.