Chapter S6 – Plastic Linear for Concrete Highway
MyOMLab Operations Management
Heizer, Render and Munson
13th Edition
Find upper and lower specification limits.
Calculator Preview
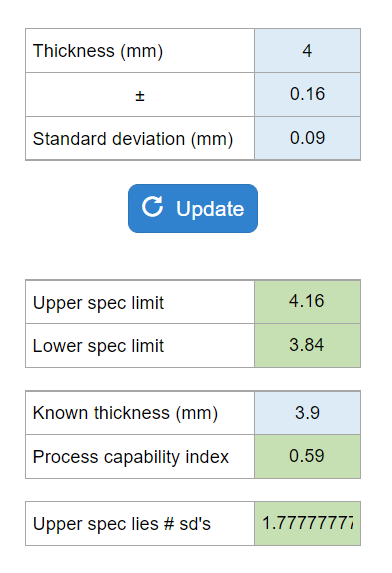
Your numbers will vary.
Find upper and lower specification limits.
Your numbers will vary.
Find upper and lower control limits.

Your numbers will vary.
Calculate the process capability ratio and determine if capable.
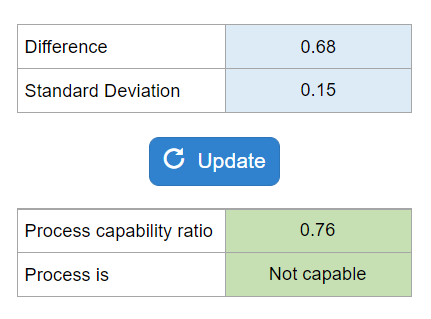
Your numbers will vary.
Calculate upper and lower control limits for mean and range charts.
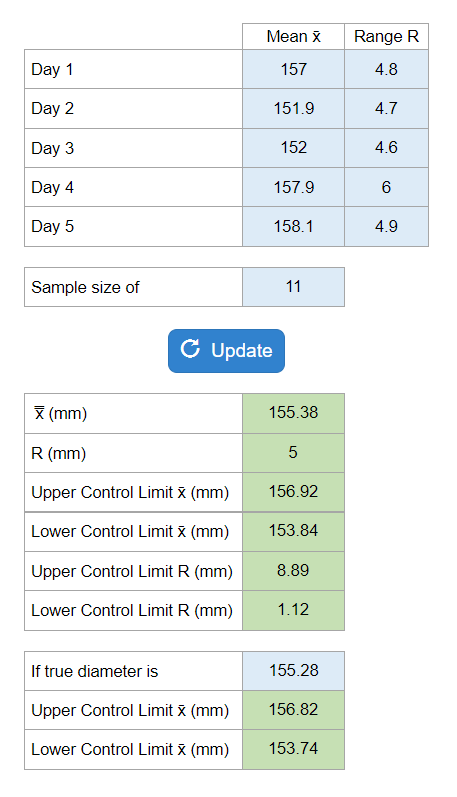
Your numbers will vary.
Determine the upper and lower control limits for the c-chart measuring incidents of nonconformities in IRS telephone inquiries, and assess the level of variation based on the c-chart.
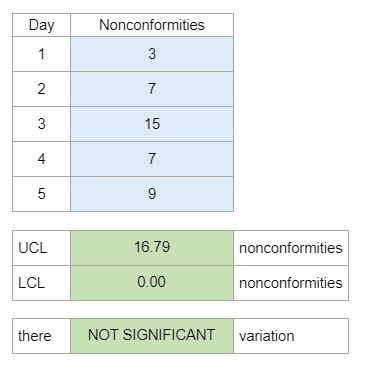
Your numbers will vary.
Determine control chart, control limits, assess process control for monitoring defectives, and analyze the impact of changing the sample size on control limits and conclusions.
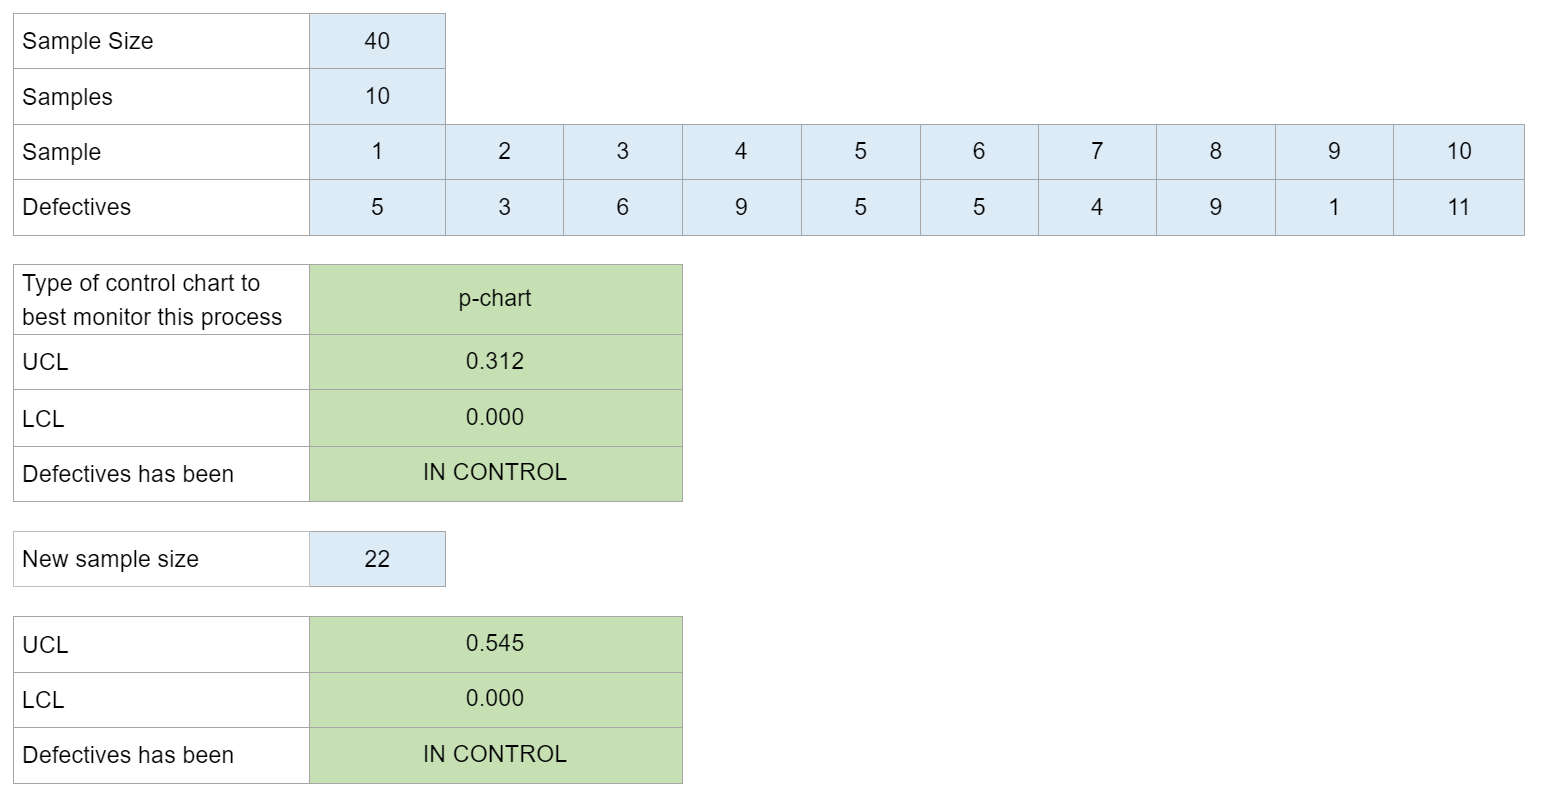
Your numbers will vary.
Determine if the process is in control for the number of defects in DNA samples taken over a series of days, based on the given control chart limits.
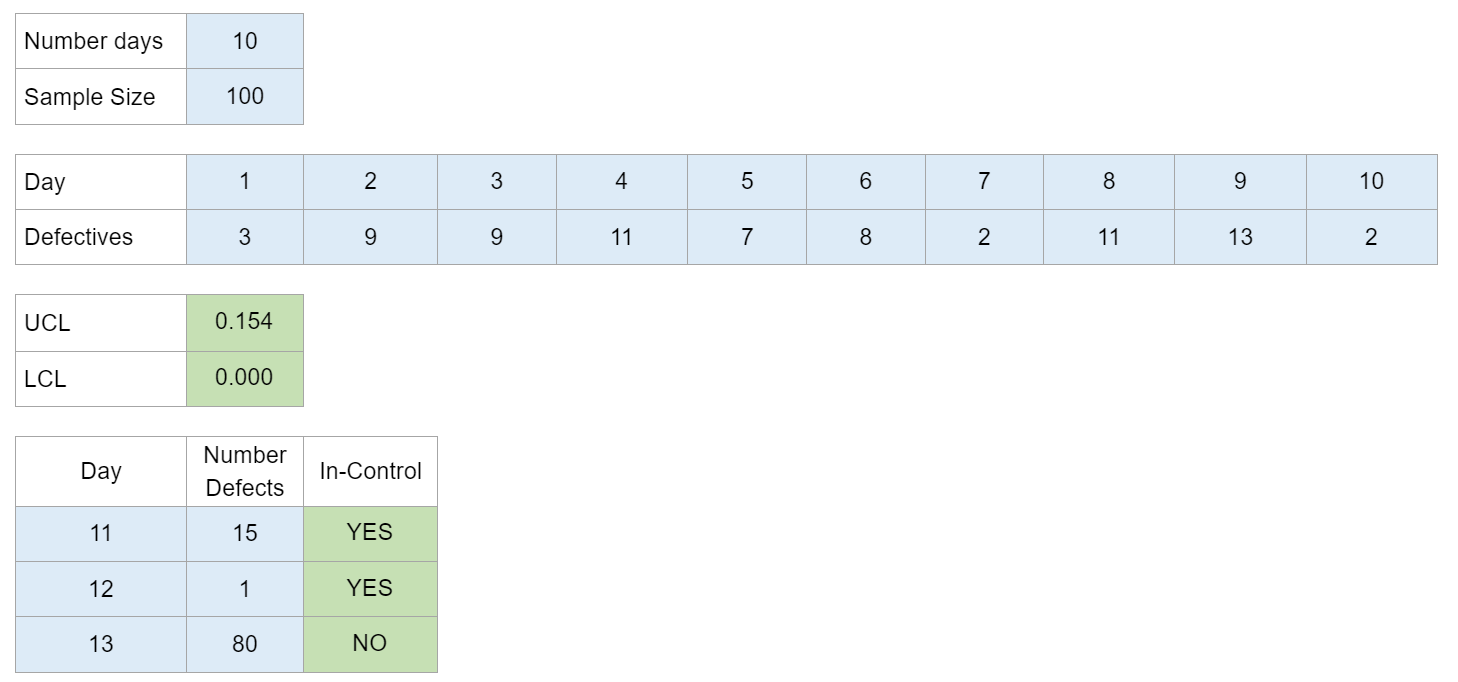
Your numbers will vary.