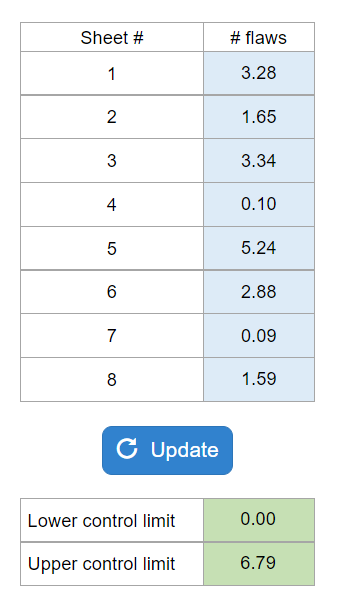
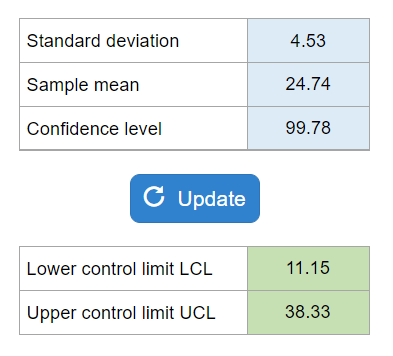
Ch 6 quiz – 3 sigma Range Chart
MyOMLab Operations Management
Heizer, Render and Munson
13th Edition
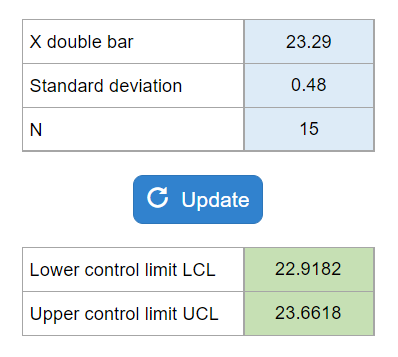
Gives you the sample size, the mean of the sample means, and the average range. Asks for the lower control limit and the upper control limit.
Calculator Preview
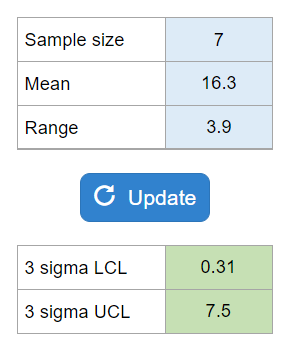
Your numbers will vary.