Survey For Window Displays Influence
Calculator Preview
Your numbers will vary.
Difficulty – Normal
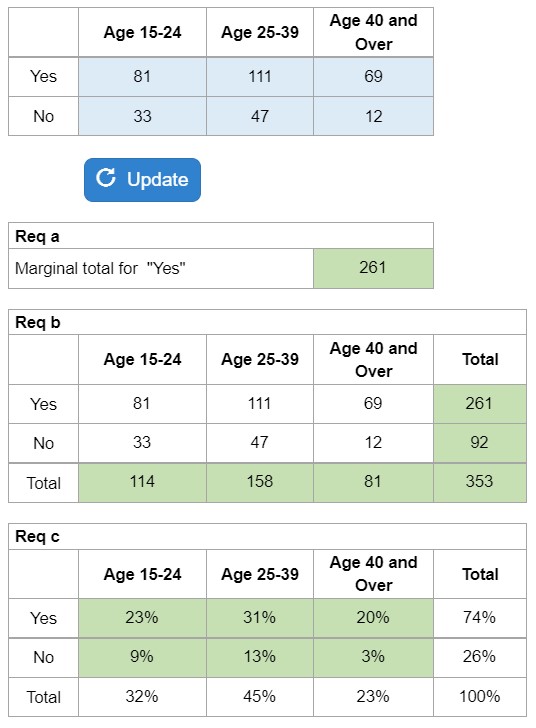
They give you a chart of responses within age groups and ask you to complete the contingency table along with calculating the relative frequencies.
Experts Have Solved This Problem
Please login or register to access this content.