Quiz – Depression Common Among College Students

0
(0)

Calculator Preview

Your numbers will vary.

Difficulty – Medium

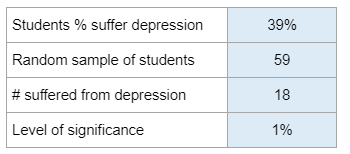
Determine the level of significance, null and alternate hypothesis, sampling distribution, if the sample size is sufficiently large, test statistics. Find the p-value, sketch the sampling distribution, and show the area corresponding to the p-value. Determine if you reject or fail to reject if data are statistically significant at level α. And interpret.

Experts Have Solved This Problem

Please login or register to access this content.

  • Search Terms: != % %. (a) (b) (c) (c), (d) (e) (enter (round , a all alternate among and answer answers application. are area as at based between changed claimed college common conclusion conducted context corresponding counseling data decimal depression depression. determine distribution do due etc. explain. fail finances, find for form found four from from some has hypotheses. hypothesis? in interpret is large? level many need. needed.) null of of depression offer on or p-value p-value. parts percentage places.) problem proportion random reject relationships, research sample sampling school schools show shown significance significance? significant size sketch some state statistic statistic. statistically stress students students suffering students? study suffer suffered suffering sufficiently suppose survey test that that the think this those through to to help two use use? value value. was what whether why will work, years you your z α? ≠
  • The use of this software is to provide check figures to compare against your own individual work. Accuracy of the check figures is not guaranteed. By purchasing credits and using our software/services, you assume all liability for the use of the software and affirm that you are abiding by your university’s academic policies. Please report any errors above.