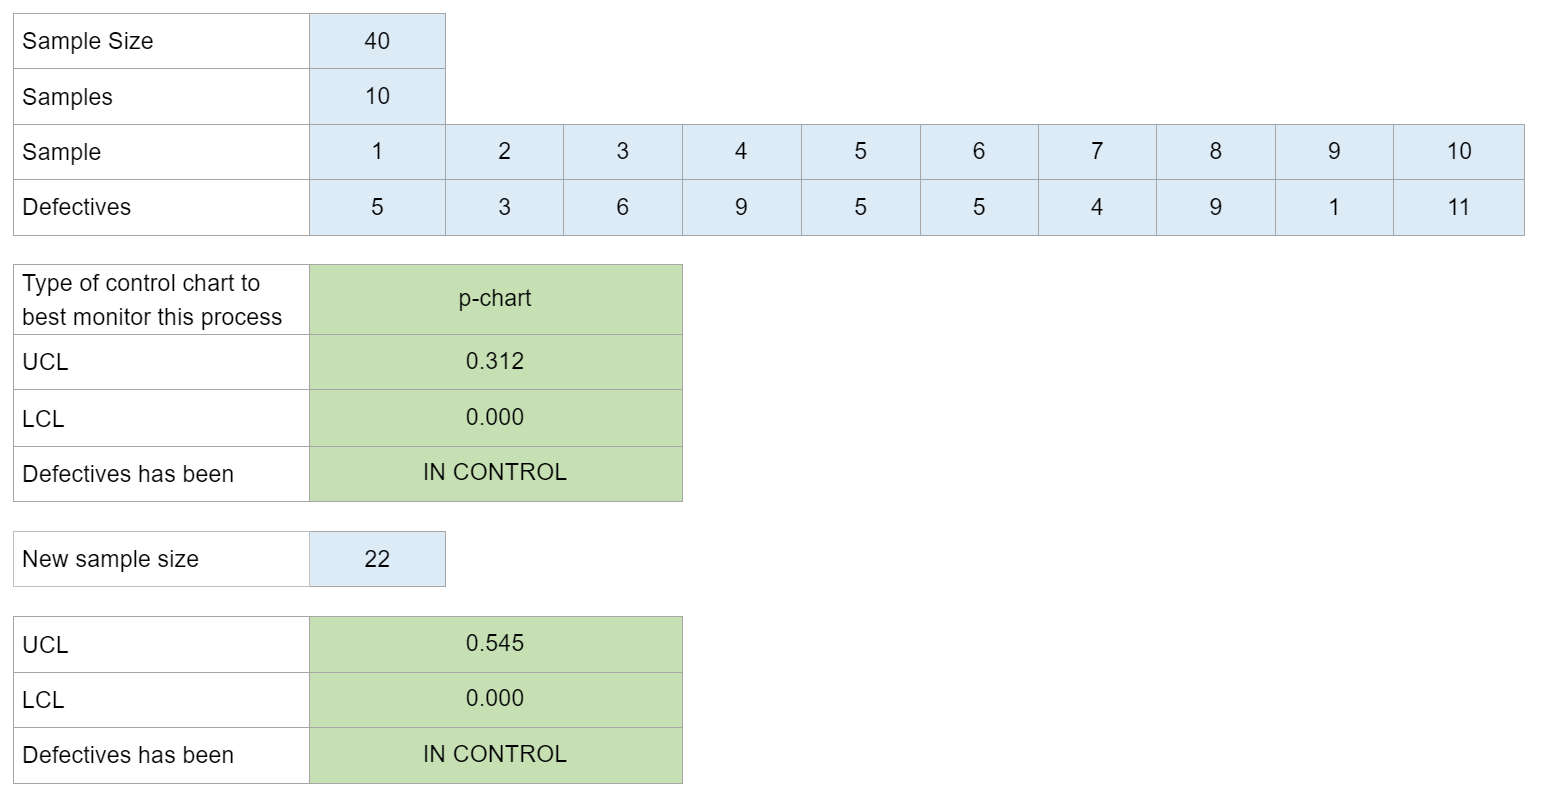
P-Chart: Monitoring Defectives in Paper Clip Manufacturing Process

5
(2)

Calculator Preview

Your numbers will vary.

Difficulty – Hard

Determine control chart, control limits, assess process control for monitoring defectives, and analyze the impact of changing the sample size on control limits and conclusions.

Experts Have Solved This Problem

Please login or register to access this content.

  • Search Terms: (enter , . .% = _______ ________ __________ _____________ a a) although and are as b) based been best between c) change? chart clips company conclusions control control? decimal defectives defectives. developed establish firm for given has have high how if in include inexpensive, instead, is jamison kovach last lcl, lclp limits limits, manufactures margin monitor number of office on other paper places). process products. profitability. provided random response results rounded sample samples. size supply that the this three to type ucl uclp variation were with would your
  • The use of this software is to provide check figures to compare against your own individual work. Accuracy of the check figures is not guaranteed. By purchasing credits and using our software/services, you assume all liability for the use of the software and affirm that you are abiding by your university’s academic policies. Please report any errors above.