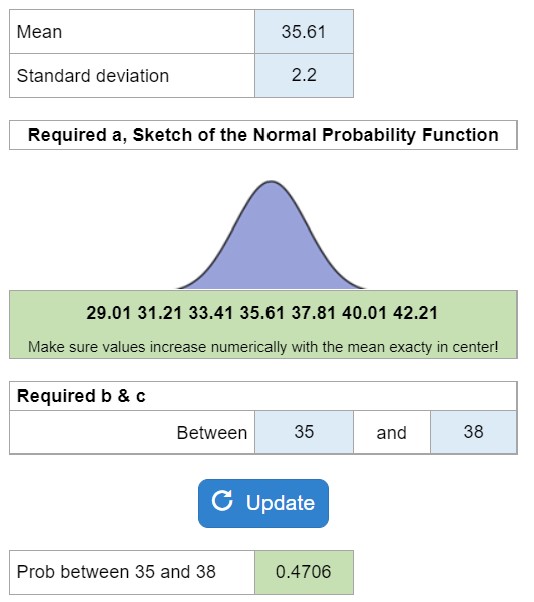
E6.09 – Sketch a Normal Curve

0
(0)

Calculator Preview

Your numbers will vary.

Difficulty – Normal

Sketch normal curve for probability density function. Determine the probability value between two numbers.

Experts Have Solved This Problem

Please login or register to access this content.

  • Search Terms: (a) (b) (c) (in (round ). + , - . .% = ? ? a a above almost and answer any areas assume at axis below between case curve decimal density deviation deviations distributed distribution figure following for function. horizontal is label lo mean normal normally o of p-lo places.) probability random shows sketch standard that the this three to touches u u- under value values variable what will with your –
  • The use of this software is to provide check figures to compare against your own individual work. Accuracy of the check figures is not guaranteed. By purchasing credits and using our software/services, you assume all liability for the use of the software and affirm that you are abiding by your university’s academic policies. Please report any errors above.