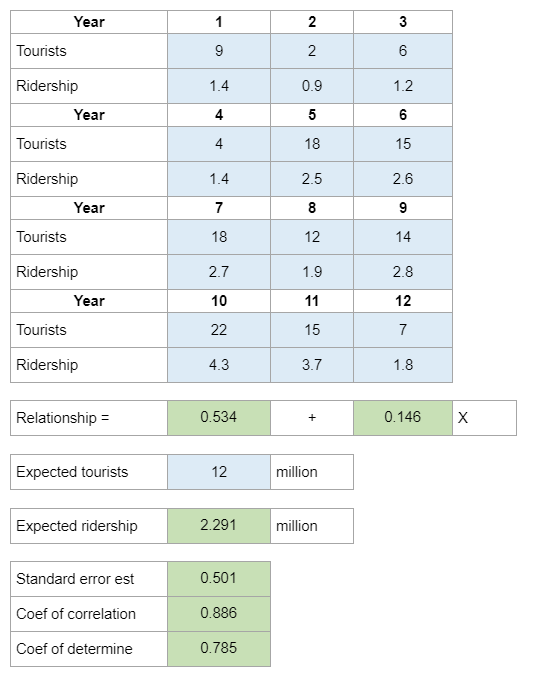
Chapter 4 – Bus and Subway Ridership in London. Analyzing the Relationship.

0
(0)

Calculator Preview

Your numbers will vary.

Difficulty – Hard

Determine the best-fit equation, expected ridership, standard error of the estimate, coefficient of correlation, and coefficient of determination.

Experts Have Solved This Problem

Please login or register to access this content.

  • Search Terms: (in (round . = and b) b, be been believed best between bus c) c, city. coefficient contains correlation d, data decimal dependent determination developed during e e) england, equation error estimate exercise expected f) f. following for have heavily if in independent is it least-squares london, million millions) model months number obtained: of only parts past pieces). places). regression relationship response responses riders ridership shows standard subway summer that the then this three tied to tourists two using variable visit visiting where will x y year years, your
  • The use of this software is to provide check figures to compare against your own individual work. Accuracy of the check figures is not guaranteed. By purchasing credits and using our software/services, you assume all liability for the use of the software and affirm that you are abiding by your university’s academic policies. Please report any errors above.