CH9 – Greene County Real Estate Sales: Hypothesis Test Analysis

0
(0)

Calculator Preview

Your numbers will vary.

Difficulty – Normal

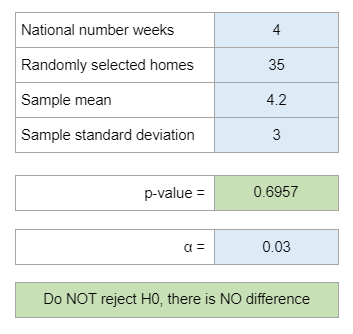
Determine if the average time to sell a home in Greene County, Ohio, in 2017 differs from the national average. Conduct a hypothesis test using the provided data, round your answer to four decimal places, and use a level of significance of α=0.05. Choose the correct conclusion based on the p-value obtained.

Experts Have Solved This Problem

Please login or register to access this content.

  • Search Terms: . = a according an and answer association average between choose conclusion. conduct correct county county, county. data decimal determine deviation differed difference do for four from greene h. home homes house hypothesis i. ii. iii. in is it iv. level mean national not number of ohio, option. p-value places. randomly realtors, reject round sale sample selected sell showed significance, significant sold standard state statistically test the there three time to took until use weeks weeks. whether with your α=.
  • The use of this software is to provide check figures to compare against your own individual work. Accuracy of the check figures is not guaranteed. By purchasing credits and using our software/services, you assume all liability for the use of the software and affirm that you are abiding by your university’s academic policies. Please report any errors above.