CH10 – Conduct a Hypothesis Test Using Sample Data

0
(0)

Calculator Preview

Your numbers will vary.

Difficulty – Normal

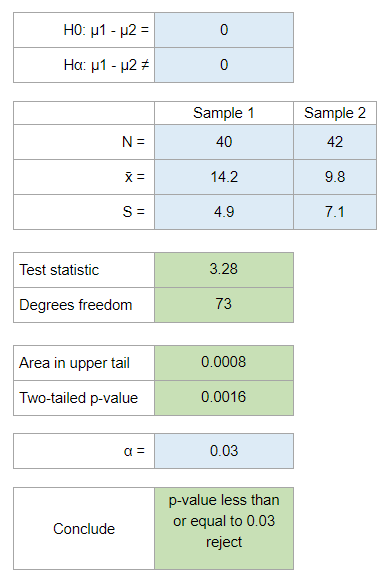
Calculate the test statistic, degrees of freedom, and p-value for independent samples taken from two populations, then determine your conclusion based on a significance level of 0.05.

Experts Have Solved This Problem

Please login or register to access this content.

  • Search Terms: sample (round (to - ; = __________ a. answer appendix are area at b. below. c. conclusion? consider d. decimals)? degrees distribution following for freedom from h h: hypothesis hα: in independent is n= number)? of p-value p-value? populations. previous results s=. s=.  sample samples statistic t table tail taken test the to two two-tailed upper use value what whole x=. your µ α=., ≠
  • The use of this software is to provide check figures to compare against your own individual work. Accuracy of the check figures is not guaranteed. By purchasing credits and using our software/services, you assume all liability for the use of the software and affirm that you are abiding by your university’s academic policies. Please report any errors above.