Ch 6 quiz – Determine the P Chart Mean, Standard Deviation, LCL, UCL
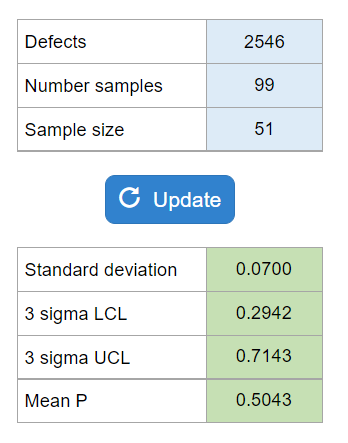
0
(0)

Calculator Preview

Your numbers will vary.

Difficulty – Normal

Gives you the total defects, the number of samples, and the sample size. Asks for the standard deviation. Also provided are mean, LCL, and UCL if needed.

Experts Have Solved This Problem

Please login or register to access this content.

  • Search Terms: , . a all and be chart control defects determine developing deviation following for from if in is lines lines? number of purposes. quality sample samples size standard the to total used want which would you “p”
  • The use of this software is to provide check figures to compare against your own individual work. Accuracy of the check figures is not guaranteed. By purchasing credits and using our software/services, you assume all liability for the use of the software and affirm that you are abiding by your university’s academic policies. Please report any errors above.