Ch 6 quiz – 3 sigma Range Chart

0
(0)

Calculator Preview

Your numbers will vary.

Difficulty – Normal

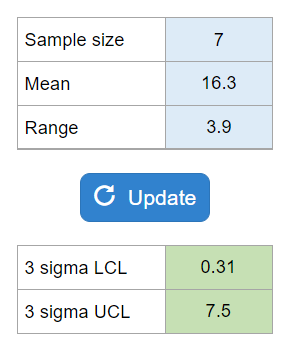
Gives you the sample size, the mean of the sample means, and the average range. Asks for the lower control limit and the upper control limit.

Experts Have Solved This Problem

Please login or register to access this content.

  • Search Terms: -sigma . .. a and are average build chart chart? five, for is lcl, manager mean of process. range respectively sample size the this to ucl what wishes
  • The use of this software is to provide check figures to compare against your own individual work. Accuracy of the check figures is not guaranteed. By purchasing credits and using our software/services, you assume all liability for the use of the software and affirm that you are abiding by your university’s academic policies. Please report any errors above.