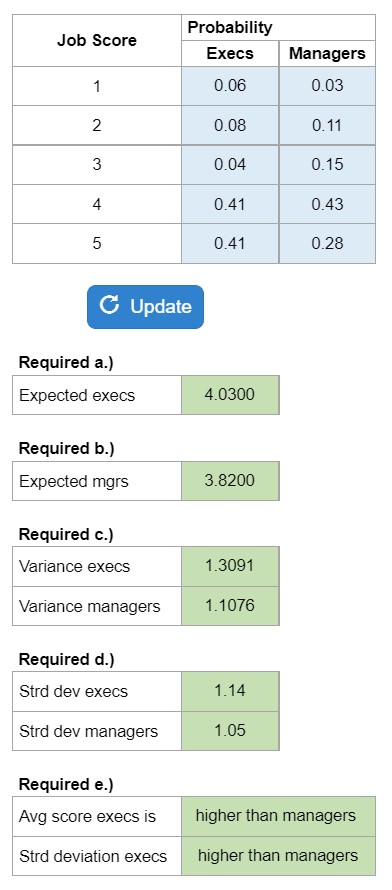
CH 5.07 – Probability Distributions: Expected Value, Variance, Strd Dev of Job Satisfaction Scores for Managers and Execs

5
(2)

Calculator Preview

Your numbers will vary.

Difficulty – Hard

Determine expected value for executives and middle managers. Compute variance, standard deviation, and compare overall.

Experts Have Solved This Problem

Please login or register to access this content.

  • Search Terms: (a) (b) (c) (d) (e) (is) (round (to (very . a a. about and answers b. both c. can compare comparison compute d. data-.xlsx decimal decimals). decimals)? deviation dissatisfied) distributions distributions. e. excel executives executives? expected file: following for from have high higher information is job lo low make managers managers. managers. the managers? midde middle more of overall places.) probability range sample satisfaction satisfied) satisfied). score scores senior standard systems the to two value variance variation what with you your
  • The use of this software is to provide check figures to compare against your own individual work. Accuracy of the check figures is not guaranteed. By purchasing credits and using our software/services, you assume all liability for the use of the software and affirm that you are abiding by your university’s academic policies. Please report any errors above.