CH 2 – 30 Students in the School of Business (Frequency Distribution)

0
(0)

Calculator Preview

Your numbers will vary.

Difficulty – Medium

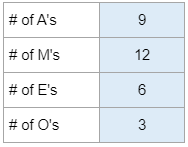
Given a list of 30 students' majors... construct a frequency distribution, a bar chart, and a relative frequency distribution.

Experts Have Solved This Problem

Please login or register to access this content.

  • Search Terms: (a) (b) (m = a accounting, accounting; am and asked bar business chart chart. construct cosntruct distribution distribution. distribution. thirty e economics; following frequency in m majors management; o of others). pie relative represents response responses school students the their thirty were were. what
  • The use of this software is to provide check figures to compare against your own individual work. Accuracy of the check figures is not guaranteed. By purchasing credits and using our software/services, you assume all liability for the use of the software and affirm that you are abiding by your university’s academic policies. Please report any errors above.