Calculator Preview
Your numbers will vary.
Difficulty – Medium
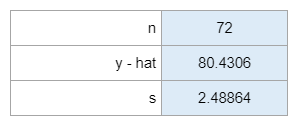
You're given a histogram and summary statistics for flights leaving on time each month from 2001-2006 and told there is no evidence of a trend. Then you're asked if the independence assumptions are met, if the randomization condition is met or is it suitably representative, if the 10% condition is met, and if the nearly normal condition is met. Next, you're given a confidence level and have to find and interpret the interval.
Experts Have Solved This Problem
Please login or register to access this content.