2.1.25 Structural Design of Oil Tankers
MyStatLab
Pearson
They ask you to interpret a pie chart and bar chart.
They ask you to interpret a pie chart and bar chart.
Given a list of 30 students’ majors… construct a frequency distribution, a bar chart, and a relative frequency distribution.
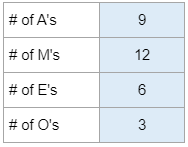
Your numbers will vary.