CH 7 – Crossover Calculator
MyOMLab Operations Management
Heizer, Render and Munson
13th Edition
Find the crossover point and possibly which option should be selected based on given demand.
Calculator Preview
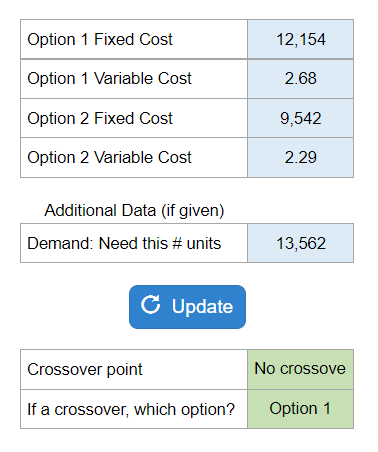
Your numbers will vary.
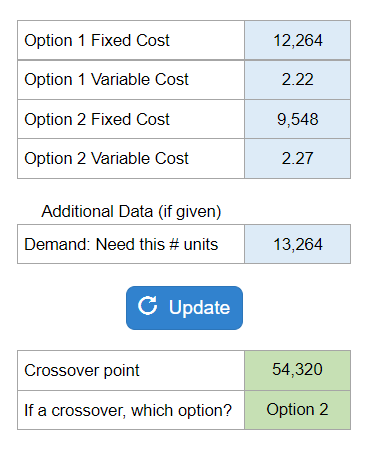
Find the crossover point and possibly which option should be selected based on given demand.
Your numbers will vary.
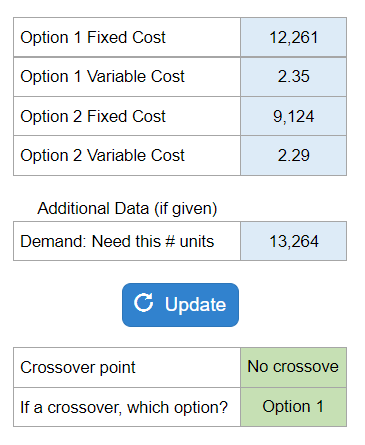
Find the crossover point and possibly which option should be selected based on given demand.
Your numbers will vary.
Find the crossover point and possibly which option should be selected based on given demand.
Your numbers will vary.
Given the number of troubleshooters, the hours in question, and the amount that each inspector can inspect in the hour along with the desired utilization… find how many troubleshooters they need.
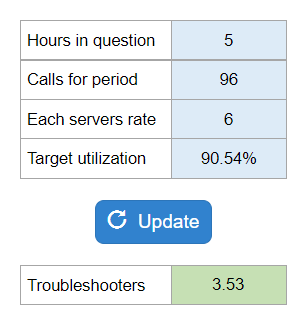
Your numbers will vary.
Gives you net revenue, cost of goods sold, total assets, and inventory. Asks for the percentage the firm has invested in inventory.
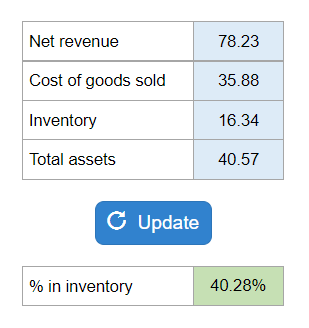
Your numbers will vary.
Gives you net income, revenue, cost of goods sold, PPE and inventory. Asks for the inventory turnover.
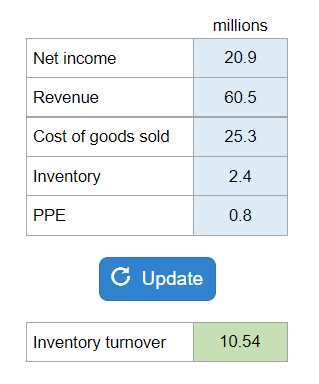
Your numbers will vary.
Gives you net income, revenue, cost of goods sold, PPE and inventory. Asks for the weeks supply that the firm has.
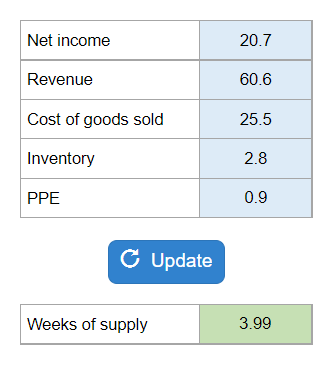
Your numbers will vary.
Given lead time, daily demand, safety stock, and container size… find the number of kanbans needed.
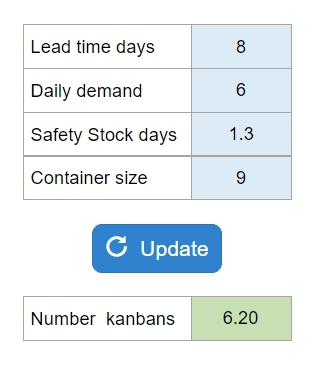
Your numbers will vary.
You are given the X bar mean, standard deviation, and desired confidence level. Asks for the upper control limits. This one does not have a sample size given.
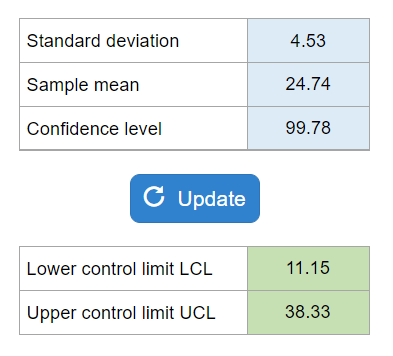
Your numbers will vary.
They give you the mean and standard deviation along with the price it cost to make the doughnuts and the price they are sold for. Asks for the optimal order size.
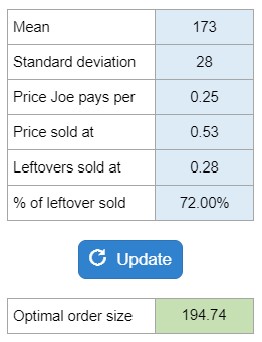
Your numbers will vary.