6.1.25 A Commuter Must Pass Through Traffic Lights
MyStatLab
Pearson
They give you a horizontal list of # of traffic lights and probabilities. They ask you for a mean and standard deviation.
Calculator Preview

Your numbers will vary.
They give you a horizontal list of # of traffic lights and probabilities. They ask you for a mean and standard deviation.
Your numbers will vary.
Gives you the sample size, the mean of the sample means, and the average range. Asks for the lower control limit and the upper control limit.
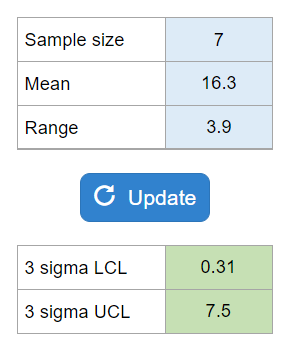
Your numbers will vary.
You are given the X double bar, standard deviation, and N. Asks for the 3 sigma control limits for an x-bar control limit.
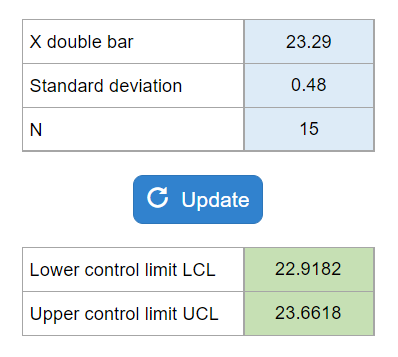
Your numbers will vary.
You are given two specification limits, the mean, and the standard deviation. Asks for the CPK and the capability.
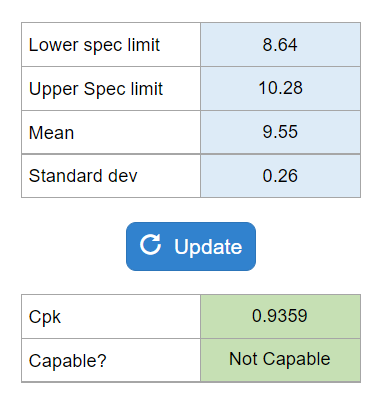
Your numbers will vary.
Gives you the total defects, the number of samples, and the sample size. Asks for the standard deviation. Also provided are mean, LCL, and UCL if needed.
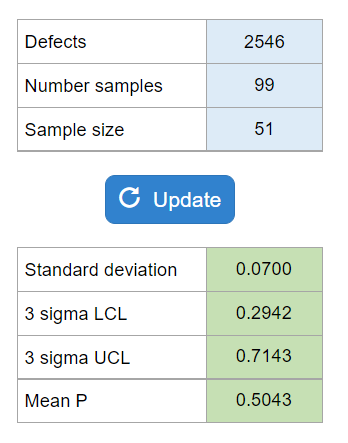
Your numbers will vary.
They give you a list of 8 flaws and ask for the lower and upper control limits for a c-chart.
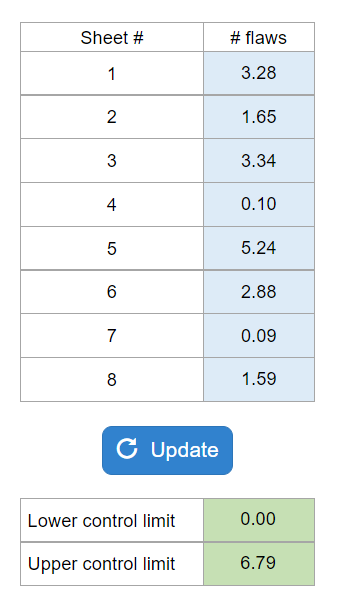
Your numbers will vary.
What % total complaints attributed to most prevalent?
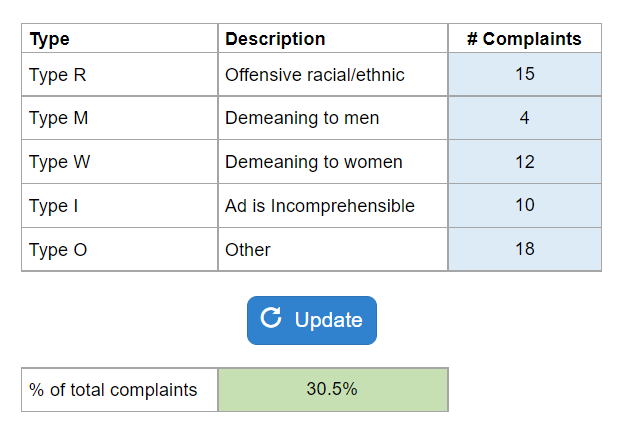
Your numbers will vary.
Use Pareto Chart to determine the greatest proportion of complaints.
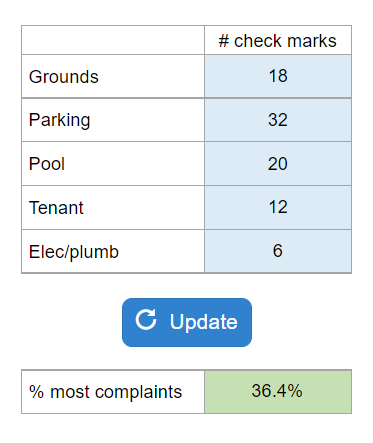
Your numbers will vary.
You are given the X bar mean, standard deviation, and desired confidence level. Asks for the upper control limits. This one does not have a sample size given.
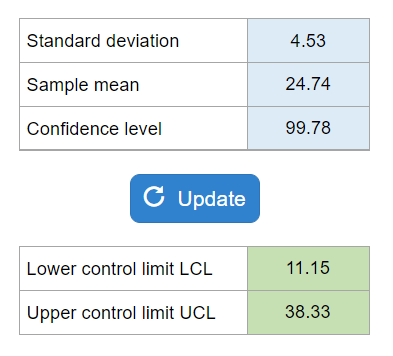
Your numbers will vary.
Calculate Average Outgoing Quality.
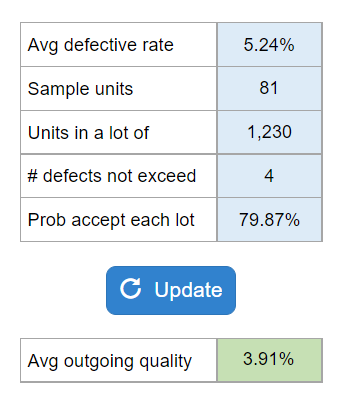
Your numbers will vary.