Chapter S6 – Wemming Chung’s Plant
MyOMLab Operations Management
Heizer, Render and Munson
13th Edition
Calculate upper and lower control limits for mean and range charts.
Calculator Preview
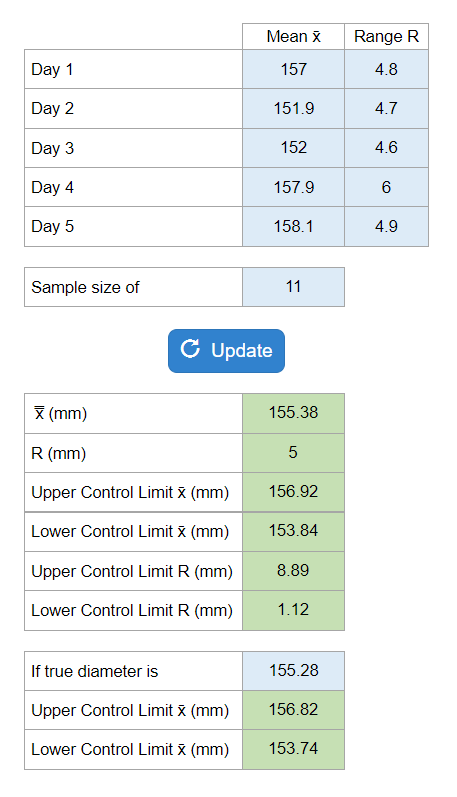
Your numbers will vary.
Calculate upper and lower control limits for mean and range charts.
Your numbers will vary.
Find Highest Expected Value of Alternatives.
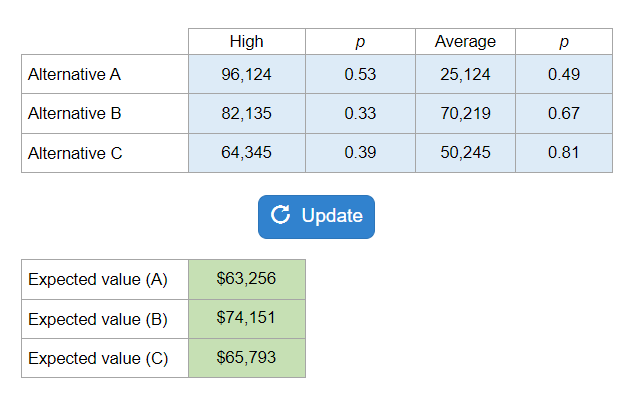
Your numbers will vary.
What is the expected production for each department next quarter?
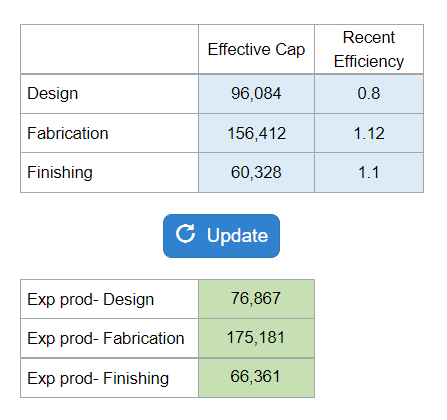
Your numbers will vary.
The breakeven point for proposals A and B.

Your numbers will vary.
Find the Net Present Value.
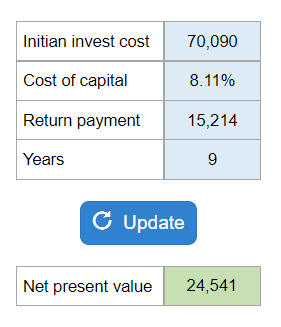
Your numbers will vary.
Throughput time, bottleneck time, and capacity.
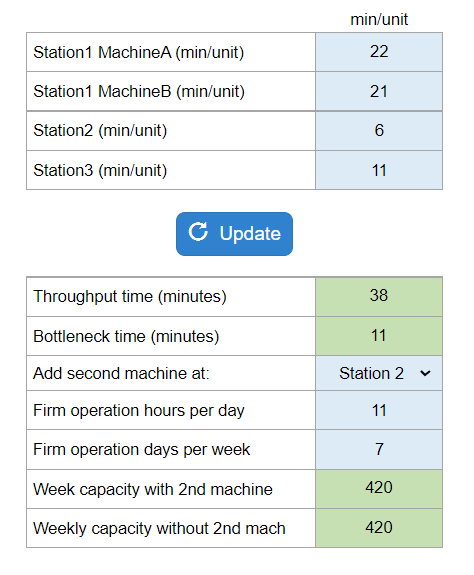
Your numbers will vary.
Find the NPV of each machine.
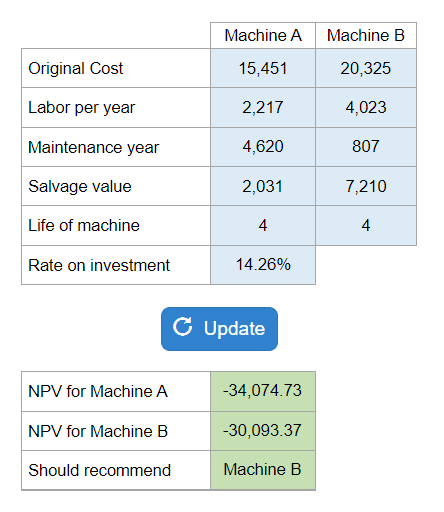
Your numbers will vary.
Bottleneck station and minutes per unit.
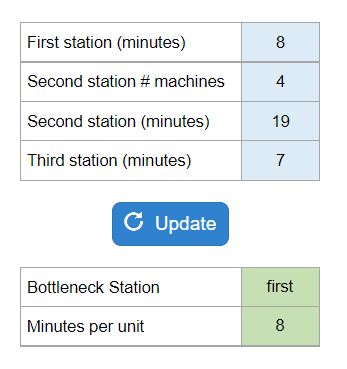
Your numbers will vary.
Calculate Utilization Rate.
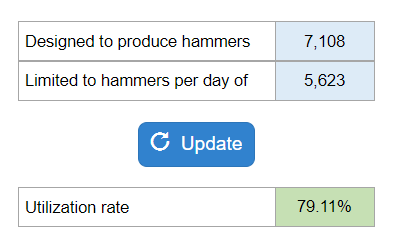
Your numbers will vary.
Determines how produced, commits technology, quality, human resources, and investment