Chapter 4.45 – Café Michigan’s
MyOMLab Operations Management
Heizer, Render and Munson
13th Edition
Coffee forecast, intercept and slope.
Calculator Preview
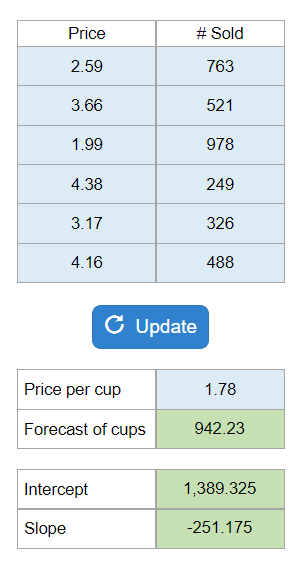
Your numbers will vary.
Coffee forecast, intercept and slope.
Your numbers will vary.
Using the exponential smoothing method, what is the forecast for weeks 2 to 10 and what is the MAD and tracking signal for the same forecast given the sales data, alpha, and initial forecast? Find forecasts for weeks 2 to 10 and the MAD.
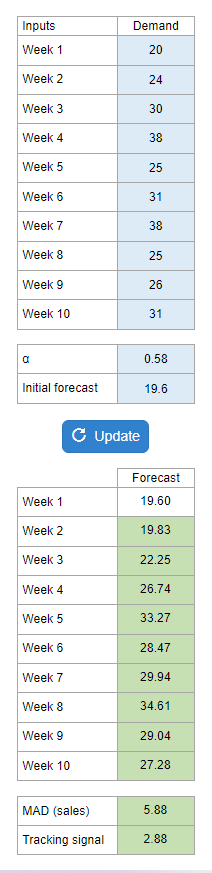
Your numbers will vary.
What % total complaints attributed to most prevalent?
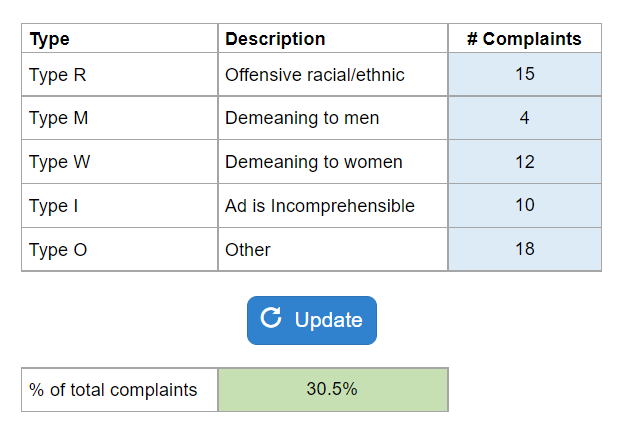
Your numbers will vary.
Use Pareto Chart to determine the greatest proportion of complaints.
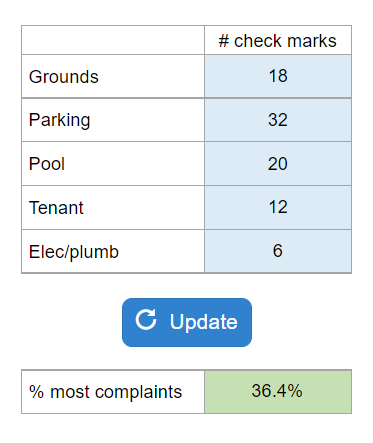
Your numbers will vary.
Breakeven points for the Pizza Shop and crossover point.

Your numbers will vary.
Calculate the revenue retrieval for Brew Master and Brew Mini coffee maker designs based on the provided tables. Round your responses to two decimal places.
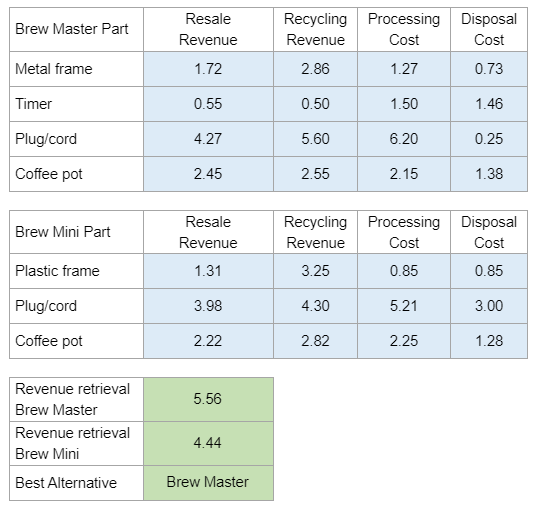
Your numbers will vary.
What is the crossover point between hybrid and alternative.
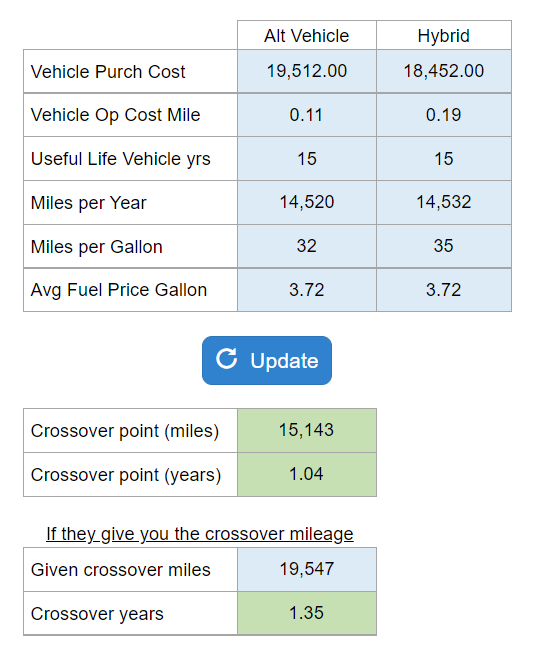
Your numbers will vary.
Calculate Average Outgoing Quality.
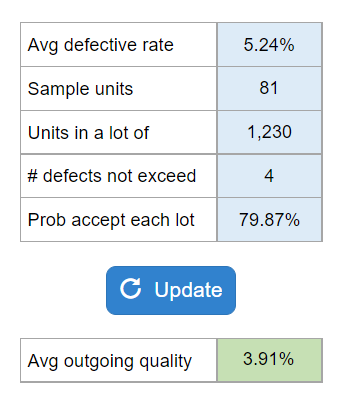
Your numbers will vary.
Find upper and lower control limits.
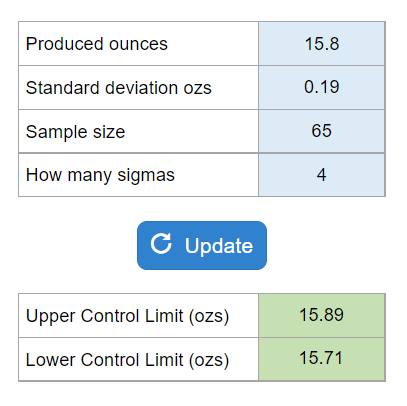
Your numbers will vary.
Find upper and lower specification limits.
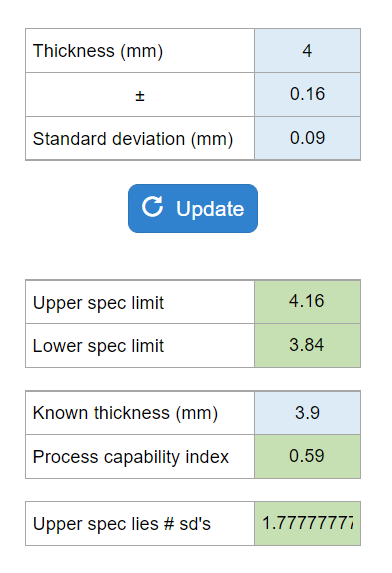
Your numbers will vary.