Problem 3.1.37 – During 20 Seasons Playing Professional Hockey
MyStatLab
Pearson
A long list of data numbers is given and student is asked to make a stem-leaf plot, box plot, answer questions.
Calculator Preview
Your numbers will vary.
A long list of data numbers is given and student is asked to make a stem-leaf plot, box plot, answer questions.
Your numbers will vary.
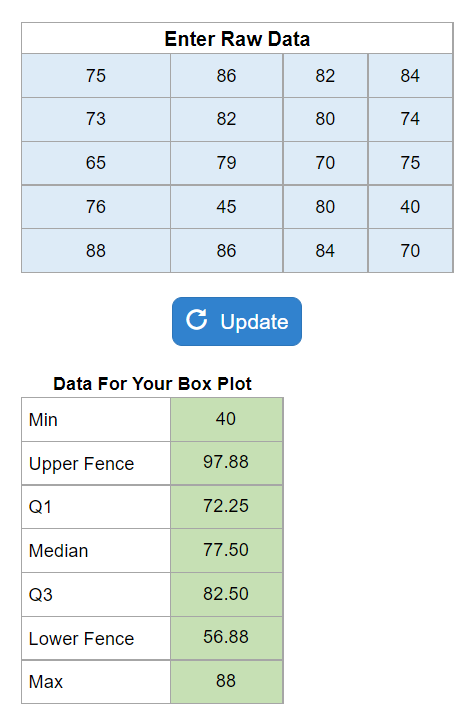
From a long list of numbers calculate the minimum, maximum, median, Q1, Q3, Range, IQR.
Your numbers will vary.
Three colored boxplots are displayed with various questions about the most expensive, least expensive, etc.
Three histograms are presented, and questions are asked about which did better, shape, uniform, unimodal, symmetric, and then must match a box plot to each.
Find Z-scores for both price and square footage and decide which is more unusual.
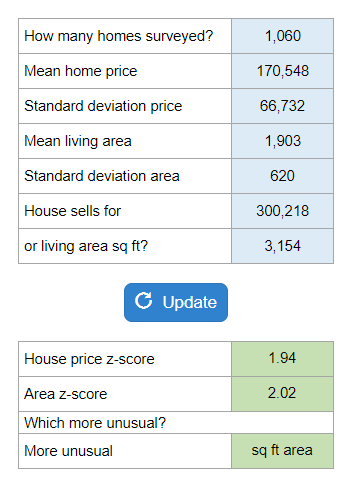
Your numbers will vary.
A skewed histogram is given with a series of questions about modal, skewed, spread, outliers, median.
Summary statistics are given and asked to interpret the data as skewed, symmetric, etc.
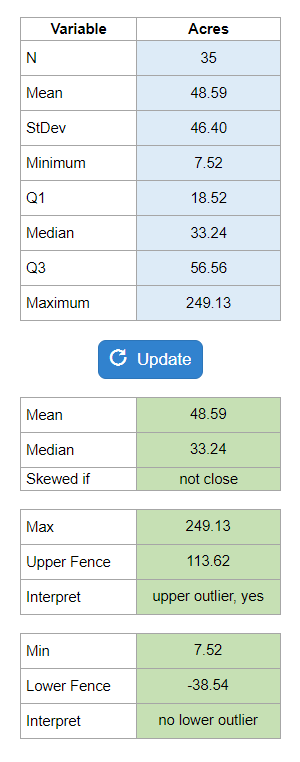
Your numbers will vary.